
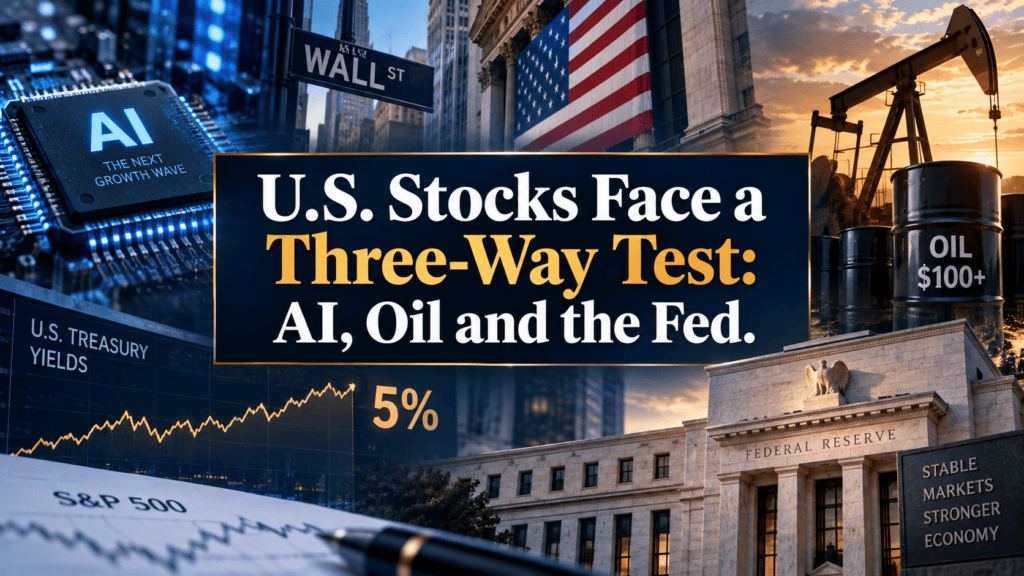
The U.S. stock market is heading into one of the more important weeks of September with three very different forces pulling on valuations at the same time.
AI-related stocks are under pressure. Oil prices have moved sharply higher. And the 10-year Treasury yield is hovering around the psychologically important 5% level just as the Federal Reserve begins its September policy meeting.
The combination matters because each factor affects stocks through a different channel.
Higher oil can keep inflation elevated. Higher inflation can make monetary policy more restrictive. Higher Treasury yields can increase the discount rate used to value future corporate earnings. And concerns about the economic return from enormous AI infrastructure spending could challenge one of the biggest growth narratives behind the U.S. equity market.
Yet the picture is not simply bearish.
The S&P 500 remains at historically elevated levels, corporate earnings remain an important support, and the U.S. economy has shown considerable resilience.
So the more useful question is not whether stocks will rise or fall this week.
It is whether earnings can remain strong enough to offset higher rates, expensive energy and a more selective market view of AI spending.
Why This Week Matters for U.S. Stocks
The timing is unusually important.
The Federal Reserve’s September 15–16 meeting begins Tuesday, while investors are digesting August inflation data and a renewed energy-price shock.
At the same time, AI-linked shares have come under pressure after prominent technology leaders called for a slower approach to AI development, while oil prices have risen amid renewed geopolitical tensions.
Reuters reported Monday that global stocks were pressured by falling AI shares and rising oil prices ahead of this week’s expected central-bank decisions.
That creates a market environment where several previously separate themes are suddenly interacting.
The important distinction is that none of these factors has to become a crisis on its own.
The risk comes from their combination.
The S&P 500 Is Starting From a Position of Strength
One reason the current market reaction deserves attention is that U.S. stocks are not entering this period after a prolonged decline.
The S&P 500 closed at 7,656.98 on September 11, according to recent market data.
That means investors are dealing with a valuation question rather than simply trying to repair a damaged market.
This matters because expensive markets tend to become more sensitive to changes in assumptions.
If investors expect strong earnings growth, higher valuations can remain sustainable.
But if interest rates rise while earnings expectations weaken, the same valuation suddenly looks less comfortable.
That is the fundamental test developing now.
August Inflation Has Complicated the Fed’s Job
The latest Consumer Price Index report showed that U.S. consumer prices increased 0.4% in August, while the overall CPI index was 3.4% higher than a year earlier.
Core CPI, which excludes food and energy, increased 2.4% over the year.
Gasoline was one of the most important contributors.
The gasoline index jumped 3.9% in August, accounting for more than one-third of the month’s increase in headline CPI.
That creates a difficult backdrop for the Federal Reserve.
A central bank can generally respond to weak growth more aggressively when inflation is comfortably under control.
When energy prices are rising and inflation is already above target, however, policymakers have less room to assume that higher prices will quickly disappear.
This is particularly important because oil has continued moving higher after the August CPI data were released.
Oil Has Become a Macro Problem, Not Just an Energy Story
Oil prices matter to the stock market in several ways.
First, higher gasoline prices affect consumers.
Second, higher fuel costs increase expenses for transportation, logistics, airlines and other energy-intensive businesses.
Third, higher oil prices can feed into inflation expectations.
And fourth, persistent energy inflation can influence how investors think about Federal Reserve policy.
The latest market moves show how quickly this relationship can matter.
On Monday, oil prices jumped again as geopolitical tensions intensified. Reuters reported that oil futures rose sharply amid new strikes and concerns surrounding Gulf energy infrastructure.
That creates a feedback loop worth watching:
Higher oil → higher inflation risk → higher rate expectations → higher Treasury yields → greater pressure on equity valuations.
The loop does not necessarily continue indefinitely.
But if oil remains elevated for long enough, the effect can become more important for financial markets.
The 10-Year Treasury Yield Is Approaching a Critical Level
The Treasury market may ultimately be the most important transmission mechanism.
Official Treasury data showed the 10-year yield at 4.96% on September 11.
By Monday, market commentary was showing the yield moving around the 5% area.
That level matters psychologically, but the economics are more important than the round number itself.
A 10-year Treasury yield close to 5% changes the competitive landscape for stocks.
An investor evaluating a company expected to generate substantial profits many years from now must now compare those future cash flows against a much higher government bond yield than was available during the low-rate era.
That does not mean stocks must fall.
It means the valuation hurdle is higher.
Why Higher Yields Matter Most for Long-Duration Stocks
Consider two hypothetical companies.
Company A generates most of its cash flow today.
Company B expects relatively modest cash flow today but substantial growth several years into the future.
If interest rates rise significantly, Company B’s valuation is generally more sensitive because a larger share of its value depends on future cash flows.
That is one reason growth and technology stocks can react strongly when Treasury yields move higher.
The current environment is therefore not simply about “stocks versus bonds.”
It is about how investors value time.
When the risk-free rate rises, future earnings become less valuable in today’s dollars.
That makes the level and direction of Treasury yields particularly important for high-growth sectors.
AI Is the Third Variable
The AI story adds another layer.
For several years, investors have viewed AI investment as one of the most important growth engines in the U.S. economy.
Companies are spending enormous amounts on:
- data centers,
- advanced chips,
- networking infrastructure,
- cloud computing,
- electricity capacity,
- software,
- and AI research.
That spending has created major revenue opportunities throughout the technology ecosystem.
But the market is now asking a harder question:
How quickly will those investments produce economic returns?
That is a different question from whether AI technology is useful.
AI can be genuinely transformative while individual companies still face periods of valuation pressure.
The Market May Be Moving From “AI Is Good” to “Which AI Spending Is Good?”
This is an important shift.
During the early stages of a major technology cycle, investors often focus on the size of the opportunity.
Later, they begin asking more detailed questions:
- Who captures the revenue?
- Who has pricing power?
- How much capital expenditure is required?
- What is the useful life of the hardware?
- How quickly does infrastructure become obsolete?
- What return does the customer receive?
- Can revenue grow faster than depreciation and financing costs?
Those questions are becoming increasingly important.
The result could be a more selective technology market rather than the end of the AI investment cycle.
That distinction matters for the broader S&P 500.
The Three-Way Stress Test
A useful way to analyze the current market is to reduce the situation to three variables:
1. Interest rates
The 10-year Treasury yield is approaching 5%.
The key question is whether yields stabilize or continue moving higher.
2. Oil
Crude prices are elevated and geopolitical developments remain a major source of uncertainty.
The key question is whether the oil shock is temporary or persistent.
3. Earnings
The third variable is corporate profitability.
The key question is whether earnings expectations remain strong enough to absorb higher financing and discount rates.
This produces four broad scenarios.
| Rates | Oil | Earnings | Potential market effect |
|---|---|---|---|
| Stable | Lower | Strong | Most supportive |
| Higher | Stable | Strong | Valuation pressure but potentially manageable |
| Higher | Higher | Strong | Greater volatility and sector rotation |
| Higher | Higher | Weakening | Most difficult combination |
This framework is more useful than predicting a specific S&P 500 level.
Why?
Because markets ultimately respond to the relationship between price, rates and expected earnings.
Scenario One: Rates Stabilize and Earnings Hold Up
This would be the most constructive outcome.
If Treasury yields stop climbing, oil prices stabilize and corporate earnings expectations remain firm, stocks could potentially absorb the current concerns.
Technology stocks might still experience significant rotation.
However, weakness in one sector could be offset by strength elsewhere.
In this scenario, the market’s biggest problem would be valuation rather than fundamental deterioration.
Scenario Two: Yields Rise but Earnings Stay Strong
This is more complicated.
Higher Treasury yields would continue to pressure valuations.
However, strong earnings growth could provide an offset.
This is why watching earnings revisions is so important.
A stock can remain relatively resilient when its valuation is high if analysts continue raising profit expectations.
The same stock becomes much more vulnerable if the earnings outlook begins falling.
Scenario Three: Oil and Rates Rise Together
This is where the macroeconomic environment becomes more uncomfortable.
Higher oil can increase inflation pressure.
Higher inflation can reduce the probability of rapid monetary easing.
That can push Treasury yields higher.
At that point, both sides of the equity valuation equation become more difficult.
Investors face higher discount rates while simultaneously worrying about higher operating costs.
The effect would not necessarily be uniform across sectors.
Energy producers, for example, can benefit from higher commodity prices, while energy-intensive industries may face the opposite effect.
That creates the possibility of significant sector rotation even if the overall index remains relatively stable.
Scenario Four: Higher Rates Meet Lower Earnings Expectations
This is the scenario worth watching most closely.
If Treasury yields remain elevated while corporate earnings expectations begin falling, the market loses one of its strongest defenses.
In that environment, valuation compression can become more widespread.
Importantly, this does not require an immediate recession.
Markets can reprice simply because investors decide that future profits deserve a lower valuation multiple.
That is why earnings revisions may ultimately matter more than the day’s headline market move.
What the Federal Reserve Meeting Could Change
The Federal Reserve’s September 15–16 meeting is now the immediate policy catalyst.
The market will be watching more than the actual rate decision.
Investors will also examine the Fed’s language around:
- inflation,
- energy prices,
- labor-market conditions,
- economic growth,
- future rate decisions,
- and financial conditions.
The challenge for policymakers is straightforward.
If inflation remains elevated because of energy prices, cutting rates aggressively becomes more difficult.
But if economic growth or employment weakens substantially, keeping policy restrictive also carries risks.
The Fed therefore has to balance two competing problems.
That tension could make the September meeting especially important for financial markets.
What Traders Should Watch Beyond the Headlines
The S&P 500 itself is only one signal.
Several cross-market relationships may provide better information.
Treasury yields
Watch whether the 10-year yield can move back below the recent range or establishes a sustained position around 5%.
Crude oil
Watch whether the current oil spike begins to reverse or becomes persistent.
Technology breadth
If AI-related weakness remains concentrated in semiconductors and infrastructure stocks, the market may simply be rotating.
If selling spreads broadly across technology and other growth sectors, the signal becomes more significant.
Market breadth
A market supported by many sectors is structurally different from an index being held up by a small number of mega-cap companies.
Earnings revisions
This may be the most important variable.
If earnings expectations remain strong, higher rates may be absorbed.
If earnings estimates begin moving lower, the same interest-rate environment becomes much more dangerous for valuations.
A More Useful Way to Think About the Current Market
The temptation in a week like this is to ask:
“Is this the beginning of a stock-market crash?”
That is not a particularly useful analytical question.
A better question is:
“Which assumption supporting current equity valuations is changing?”
Right now, several assumptions are being tested.
The first is that inflation would continue moving toward the Federal Reserve’s target.
The second is that interest rates would remain sufficiently supportive for elevated equity valuations.
The third is that AI investment would continue expanding without a meaningful reassessment of its economic returns.
The fourth is that energy prices would not create a renewed inflation shock.
If only one assumption changes, the market may absorb it.
If several change simultaneously, volatility can increase quickly.
Why the Market Could Still Prove Resilient
There is an equally important bullish argument.
The U.S. economy has not suddenly stopped functioning.
Companies continue to invest.
Consumers continue to spend.
AI infrastructure remains a major source of capital expenditure.
And corporate earnings remain the fundamental driver of long-term equity value.
That means the current market environment should not automatically be interpreted as a signal that the U.S. expansion is ending.
Instead, it may represent a transition from an environment where investors could largely ignore macroeconomic constraints to one where rates, energy and earnings once again matter simultaneously.
That is a significant change in market behavior.
What This Means for Quantitative Market Research
For quantitative traders and researchers, this environment offers an interesting testing opportunity.
Rather than building a strategy around a single threshold such as “10-year yield above 5%,” a more robust research framework could examine combinations of:
- 10-year Treasury yield regime,
- crude oil momentum,
- S&P 500 trend,
- market breadth,
- volatility,
- earnings revisions,
- and technology-sector relative strength.
The objective should not be to discover a supposedly perfect signal.
Instead, researchers can test whether combinations of macro variables historically changed the distribution of subsequent returns, volatility or drawdowns.
Any such analysis should account for transaction costs, slippage, survivorship bias, look-ahead bias and regime changes.
Most importantly, historical relationships should be treated as evidence rather than guarantees.
The Bottom Line
U.S. stocks are entering a more demanding environment.
The market is dealing with AI uncertainty, elevated oil prices and Treasury yields approaching 5%, while the Federal Reserve prepares for its September 15–16 policy meeting.
None of these factors alone guarantees a major equity decline.
The more important issue is how they interact.
If yields stabilize, oil prices retreat and earnings remain resilient, the market could absorb the current stress through volatility and sector rotation.
If oil remains elevated, Treasury yields move higher and earnings expectations deteriorate at the same time, the pressure on equity valuations could become much broader.
For market participants, therefore, the key signal is not simply whether the S&P 500 rises or falls tomorrow.
It is whether rates, oil and earnings begin moving against stocks at the same time.
That is the three-way test now facing the U.S. equity market.
Publication date: September 14, 2026
Last updated: September 14, 2026
Author: BacktestCart Editorial Team
Educational disclaimer: This article is for informational and research purposes only. It is not personalized investment, financial, tax or legal advice. Historical relationships and market scenarios do not guarantee future results.
FAQ
Why are U.S. stocks under pressure right now?
AI-related concerns, higher oil prices and rising Treasury yields are combining with uncertainty ahead of the Federal Reserve’s September 15–16 meeting. The combination is putting pressure on growth-stock valuations and increasing market volatility.
Why does a 5% 10-year Treasury yield matter?
A higher Treasury yield increases the return available from government bonds and raises the discount rate applied to future corporate cash flows. This can put particular pressure on high-growth companies whose valuations depend heavily on future earnings.
Does $100 oil automatically mean stocks will fall?
No. Higher oil prices can benefit energy companies while increasing costs for other businesses. The broader stock-market effect depends on how persistent the price increase becomes and whether it pushes inflation and interest-rate expectations higher.
Is the AI investment boom ending?
Current volatility does not prove that the AI investment cycle is ending. The market is increasingly focused on whether the enormous capital being committed to AI infrastructure will generate sufficient economic returns.
What should investors watch after the Fed meeting?
Beyond the rate decision, investors should watch the Fed’s inflation assessment, comments about energy prices and the future policy path, as well as Treasury yields and corporate earnings expectations.
Explore More Market Research
Go deeper with market insights, trading research and historical backtested data from BacktestCart.
Trading & Investing Insights
Explore practical insights covering U.S. markets, trading, investing, strategies, technical analysis and backtesting research.
Explore Insights →Backtested Historical Data
Explore historical trading data, backtested results, strategy research and market evidence designed for deeper quantitative analysis.
Explore Historical Data →Sources & Further Reading
- U.S. Bureau of Labor Statistics — Consumer Price Index, August 2026
Used for the latest U.S. inflation and gasoline data.
BLS CPI — August 2026 - U.S. Department of the Treasury — Daily Treasury Par Yield Curve Rates
Used for official Treasury yield data, including the 10-year yield.
U.S. Treasury Daily Treasury Rates - Federal Reserve — September 2026 FOMC Calendar
Used to verify the September 15–16 Federal Reserve meeting.
Federal Reserve September 2026 FOMC Calendar