
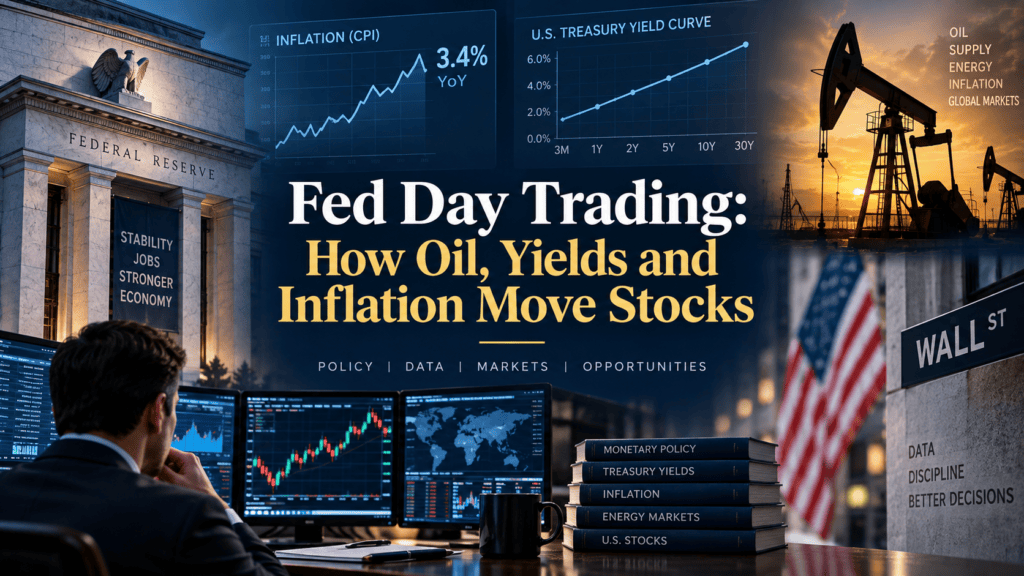
The September 2026 Federal Reserve meeting is unfolding against a market backdrop that is considerably more complicated than a simple “rate hike versus no hike” decision.
The Federal Open Market Committee is meeting September 15–16, with its policy statement and press conference scheduled for September 16. The meeting is also associated with a new Summary of Economic Projections.
Meanwhile, U.S. inflation remains above the Federal Reserve’s long-run 2% objective, oil prices have surged amid geopolitical supply concerns, and Treasury yields have moved sharply higher.
For traders, that combination matters because Fed-day volatility is often driven less by the headline rate decision than by the gap between what the market expected and what policymakers actually communicate.
The challenge is therefore to separate the decision itself from the broader repricing of interest rates, inflation expectations, economic growth and risk.
What Is Happening Before the Fed Decision?
The latest official inflation data provide an important starting point.
The Bureau of Labor Statistics reported that the Consumer Price Index increased 0.4% in August 2026 on a seasonally adjusted basis. The index was up 3.4% from a year earlier, while core CPI increased 0.3% in August and 2.4% over the previous 12 months.
Energy has become particularly important.
Gasoline prices rose 3.9% in August, accounting for more than one-third of the monthly increase in the overall CPI index. The broader energy index increased 2.1% during the month and was up 16.3% over the year.
That creates a difficult policy backdrop.
Higher energy prices can increase headline inflation directly. They can also affect transportation, production and consumer spending indirectly. Consequently, traders may pay close attention to whether policymakers view the current inflation pressure as temporary or something that could become more persistent.
At the same time, Treasury yields have been sending their own signal.
The Treasury’s official data show the 10-year yield at 4.97% on September 14, after reaching 4.96% on September 11.
Reuters reported on September 15 that the 10-year Treasury yield had moved above 5%, adding another source of pressure for rate-sensitive areas of the equity market.
This matters because stocks are not valued in isolation. Changes in Treasury yields can alter the discount rate applied to future corporate cash flows and can also change the relative attractiveness of equities compared with fixed-income securities.
Why Fed Day Can Be More Volatile Than a Normal Trading Day
A normal trading session gradually incorporates information.
Fed day is different.
Investors spend days positioning around an event. Economic releases, futures pricing, bond yields and analyst expectations all contribute to a market consensus.
Then the policy announcement arrives.
If the decision is exactly what investors expected, the initial move can still be surprisingly large because the market immediately turns its attention to the language surrounding the decision.
There are several layers to the reaction:
- The actual policy decision
- The wording of the statement
- Economic projections
- Interest-rate expectations
- The press conference
- The bond-market reaction
- The equity-market reaction
The result can be a market that initially moves one way and then reverses direction as traders digest the details.
That is one reason headline-based trading can be particularly difficult during major central-bank events.
The Three-Market Relationship Traders Should Watch
A useful way to analyze the current environment is to connect three markets:
Oil → Inflation → Interest rates → Stocks
Oil does not determine the Fed’s decision by itself. However, a sustained increase in energy prices can complicate the inflation outlook.
The second connection is Treasury yields.
If inflation expectations rise or traders expect tighter monetary policy, Treasury yields can move higher. Higher yields can put pressure on valuation-sensitive equity groups.
The third connection is the stock market itself.
This produces an important analytical distinction:
A stock-market decline caused by higher yields is not necessarily the same event as a decline caused by deteriorating corporate earnings.
The price chart may look similar, but the underlying market mechanism is different.
For traders and quantitative researchers, identifying that distinction can improve the interpretation of historical price behavior.
The Market May Care More About the Path Than the Decision
Suppose the Fed makes the policy decision investors expected.
That does not automatically make the event neutral.
Imagine that markets have already priced in a particular future path for interest rates. The Fed then delivers the expected current decision but communicates a more restrictive outlook for future policy.
The immediate effect could be higher Treasury yields and renewed pressure on rate-sensitive stocks.
The opposite can also happen.
If the decision itself is unchanged but policymakers communicate a softer future path, yields could decline and risk assets could respond positively.
This is why Fed-day analysis should not stop at the headline announcement.
The expected future path of policy can matter more than the single meeting’s decision.
CME Group’s FedWatch tool illustrates this concept by using 30-Day Fed Funds futures to show market-implied probabilities of future FOMC rate moves. Those probabilities represent market pricing, not a guarantee of what policymakers will ultimately do.
An Original Trading Framework: Watch the Reaction Chain
A useful way to study Fed-day behavior is to focus on the reaction chain rather than predicting the headline.
Consider four variables:
| Variable | Initial Question |
|---|---|
| Fed decision | Was it different from expectations? |
| Treasury yields | Are yields confirming or rejecting the interpretation? |
| Equity breadth | Is the move broad or concentrated? |
| Volatility | Is price discovery becoming more unstable? |
The key is the sequence.
For example, suppose the Fed announcement is perceived as restrictive and Treasury yields rise. If major equity indexes also fall while breadth deteriorates, the market reaction is internally consistent.
Now consider the opposite.
Suppose yields rise sharply but stocks barely weaken and market breadth remains resilient.
That tells a different story.
It may suggest that equity investors had already discounted much of the rate risk, or that corporate earnings expectations are strong enough to offset part of the valuation pressure.
This is not a prediction. It is a framework for interpreting market behavior.
Why Oil Makes the September 2026 Setup Different
Oil is especially relevant to this meeting because geopolitical developments have pushed crude prices sharply higher.
Reuters reported September 15 that Brent crude had risen above $105 per barrel while U.S. crude moved above $100 amid concerns over disruptions to Middle Eastern energy infrastructure.
The Energy Information Administration has also highlighted how disruptions around the Strait of Hormuz can materially alter its oil-market assumptions. Its June outlook said Middle Eastern production cuts and disrupted shipments were creating substantial inventory pressure.
For U.S. equity traders, the important question is not simply whether oil is rising.
It is whether higher oil prices begin to change expectations for:
- inflation,
- consumer spending,
- transportation costs,
- corporate margins,
- interest rates,
- and economic growth.
That creates the possibility of a more complicated market reaction.
Energy producers may respond differently from airlines, transportation companies or energy-intensive businesses. Meanwhile, higher yields can create a separate headwind for growth-oriented companies.
In other words, one macro shock can create winners and losers simultaneously.
What Traders Should Watch After the Announcement
The first reaction is not necessarily the final reaction.
For that reason, traders studying Fed-day behavior should pay attention to several stages.
Stage 1: The initial headline move
The first few minutes can contain extreme price movement.
That movement may reflect automated systems reacting to the statement rather than a fully developed fundamental interpretation.
Stage 2: Treasury confirmation
The bond market provides an important cross-check.
If Treasury yields jump and remain elevated, the market may be interpreting the communication as more restrictive.
If yields initially rise and then reverse lower, the first equity reaction may also change.
Stage 3: Sector dispersion
Broad indexes can hide substantial differences underneath the surface.
Technology, financials, utilities, real estate and energy companies can respond differently to changing rates and commodity prices.
Stage 4: The press conference
The press conference can introduce a second wave of volatility.
Questions from journalists can force policymakers to address issues that were not fully resolved by the initial statement.
Stage 5: The following session
One of the most useful observations for historical research is what happens after the event.
A market that closes sharply lower but recovers most of the move the following day represents a different volatility regime from a market that begins a multi-day trend.
Why Stop-Loss Assumptions Matter on Fed Days
High volatility also exposes an important weakness in simple backtests.
A strategy may assume that a stop-loss is executed exactly at its specified price.
Real markets do not always behave that neatly.
FINRA notes that during volatile markets, a stop order can be executed at a price significantly different from the specified stop price. Rapid price movements can also trigger stops before prices subsequently stabilize.
The SEC similarly explains that a stop order becomes a market order once its stop price is reached.
Therefore, a historical strategy that uses precise stop prices should consider:
- gap risk,
- slippage,
- spread widening,
- liquidity,
- execution timing,
- and order type.
These factors can become especially important around scheduled macroeconomic events.
What a Robust Backtest Should Do With Fed-Day Trades
A backtest that includes Fed-day signals should not simply calculate entry and exit prices from historical candles.
It should clearly define its assumptions.
At minimum, researchers should consider:
Transaction costs: Even when headline commissions are low or zero, real execution can involve spreads, regulatory charges and other costs.
Slippage: The assumed fill may differ from the theoretical market price.
Look-ahead bias: The strategy must use only information that was available at the actual decision time.
Survivorship bias: A historical stock universe should not contain only companies that survived and remained successful.
Overfitting: Adding too many Fed-specific filters can make a strategy look impressive historically while reducing its usefulness out of sample.
Out-of-sample testing: The strongest test is whether the rules continue to behave reasonably outside the period used to develop them.
Drawdown: Average return alone does not describe the experience of holding a volatile strategy.
Robustness: Results should ideally survive reasonable changes in parameters rather than depending on one precise threshold.
These considerations are particularly important when studying event-driven trading because the number of major Fed events in a historical sample is relatively small.
A strategy can therefore appear statistically attractive simply because of a handful of unusually large market moves.
Four Possible Market Reaction Regimes
Rather than forecasting a single outcome, it is more useful to think in scenarios.
| Regime | Treasury Yields | Stocks | Interpretation |
|---|---|---|---|
| Dovish repricing | Lower | Potentially stronger | Rate expectations ease |
| Hawkish repricing | Higher | Potentially weaker | Discount rates rise |
| Inflation shock | Higher | Mixed/weak | Oil and inflation dominate |
| Growth concern | Lower | Weak | Rates fall because growth expectations deteriorate |
The fourth scenario is particularly important.
Falling Treasury yields are not automatically bullish for stocks.
If yields fall because investors expect easier policy due to weakening economic conditions, equity prices can still decline.
That is why the direction of yields alone is insufficient.
The reason yields are moving matters.
The Bigger Lesson for U.S. Traders
The September 2026 setup demonstrates why event-driven trading cannot be reduced to predicting whether the Fed raises, cuts or holds rates.
The market is simultaneously processing inflation, oil, Treasury yields, economic growth, corporate earnings expectations and geopolitical risk.
The Federal Reserve’s July statement said inflation remained elevated relative to its 2% goal and specifically noted energy-related supply shocks, while the September meeting is scheduled as a two-day meeting with new economic projections.
That makes the September meeting particularly useful for studying the interaction between policy expectations and market pricing.
For traders, the most informative signal may not be the first five-minute move.
For researchers, the more valuable question may be what happens over the next several sessions.
And for backtesting, the central issue is whether a strategy can distinguish between ordinary volatility and a genuine change in the underlying market regime.
What Comes Next?
The immediate catalyst is the Federal Reserve’s September 16 policy announcement and press conference.
But the market will not stop there.
Traders will continue watching:
- Treasury yields,
- crude oil,
- inflation expectations,
- labor-market data,
- equity breadth,
- volatility,
- corporate earnings expectations,
- and the Fed’s projected policy path.
The September CPI report is not due until October 14, according to the BLS release schedule, so the next inflation reading will arrive after the Fed’s September decision.
That creates an important research window.
The market will have to price the Fed’s message while continuing to absorb incoming economic and geopolitical information.
Final Takeaway
Fed-day trading is fundamentally an exercise in expectations versus reality.
The interest-rate decision matters, but so do Treasury yields, inflation, oil prices and the policy path implied by the Fed’s communication.
In the current September 2026 environment, the combination of 3.4% headline CPI inflation, rising energy prices, elevated Treasury yields and higher crude prices gives traders several interacting variables to monitor.
The most useful analytical approach is therefore not to predict a guaranteed market direction.
Instead, observe whether the bond market, equity market, volatility and sector performance are telling the same story.
That approach also produces better research.
A strategy that appears successful only because it captures a few extreme Fed-day moves may not be robust. A strategy that continues to behave reasonably across different rate, inflation and volatility regimes provides a much more meaningful historical result.
Backtests can help reveal those patterns, but they remain historical evidence rather than guarantees of future market behavior.
Explore Backtested Trading Data
Research historical trading results for U.S. stocks and ETFs using systematic backtested market data.
Explore Backtested Data →FAQ
What is Fed-day trading?
Fed-day trading refers to analyzing or trading U.S. financial markets around Federal Reserve policy announcements. These sessions can experience unusually large price movements because investors rapidly adjust expectations for interest rates and economic conditions.
Why do Treasury yields matter for stock traders?
Treasury yields influence borrowing costs and the discount rate applied to future corporate cash flows. A sharp change in yields can therefore affect equity valuations, particularly in interest-rate-sensitive sectors.
Why can stocks fall even when the Fed cuts rates?
A rate cut can sometimes occur because policymakers are responding to weakening economic conditions. In that situation, falling rates may coincide with declining growth expectations and weaker earnings expectations.
Why are oil prices important for the Fed?
Higher oil prices can directly increase energy inflation and can also raise costs throughout the economy. However, the Federal Reserve evaluates a broad range of economic indicators rather than responding mechanically to a single commodity price.
Are Fed-day backtests reliable?
They can provide useful historical evidence, but Fed events are relatively infrequent and can produce unusually large observations. A robust study should account for transaction costs, slippage, look-ahead bias, survivorship bias, overfitting, out-of-sample performance and drawdown.
Can a stop-loss always execute at the exact stop price?
No. During volatile markets, execution can occur at a materially different price from the specified stop. FINRA specifically warns about this risk.
13. Sources & Further Reading
- Federal Reserve — September 2026 FOMC Calendar
Federal Reserve September 2026 Calendar
Used to verify the September 15–16 FOMC meeting and September 16 press conference. - Federal Reserve — FOMC Meeting Calendars and Information
Federal Reserve FOMC Calendars
Used to verify the 2026 meeting schedule and meetings associated with economic projections. - U.S. Bureau of Labor Statistics — August 2026 CPI
BLS August 2026 CPI Release
Used for August CPI, core CPI, gasoline and energy inflation data. - U.S. Department of the Treasury — Daily Treasury Rates
U.S. Treasury Daily Yield Curve Rates
Used to verify recent U.S. Treasury yield levels. - CME Group — FedWatch Tool
CME FedWatch
Used to explain how market-implied probabilities for future FOMC rate moves are derived from Fed Funds futures pricing. - FINRA — Stop Orders During Volatile Markets
FINRA: Stop Orders and Volatile Markets
Used for the discussion of stop-order execution risk during fast markets. - SEC — Stop Orders
SEC: Stop Orders
Used to verify how a stop order becomes a market order after reaching its stop price. - U.S. Energy Information Administration — Oil Market Outlook
EIA Short-Term Energy Outlook and Middle East Oil Disruptions
Used for context on how Middle East supply disruptions can affect oil-market assumptions.