
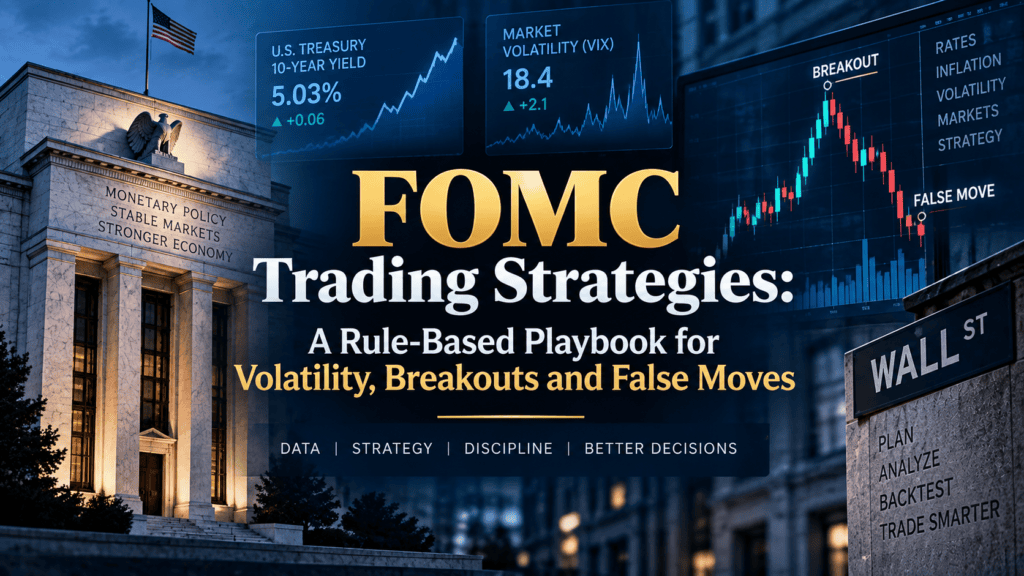
FOMC days are among the hardest sessions to trade systematically.
The problem is not simply that prices move quickly. It is that the market can completely change its interpretation of the same headline within minutes.
A rate decision may initially push stocks lower, only for the press conference to reverse the move. Treasury yields can confirm an equity breakout—or contradict it. Oil can suddenly become more important than the Fed itself when inflation expectations are already elevated.
That makes a simple directional strategy particularly vulnerable.
A more useful approach is to treat an FOMC session as a defined event window and build rules around price confirmation, volatility, Treasury yields, and time.
That is the focus of this BacktestCart framework.
The objective is not to predict what the Federal Reserve will do. Instead, the goal is to create a repeatable process that can be tested historically across FOMC announcement days.
Why September 16, 2026 Is a High-Interest Trading Session
The September FOMC meeting arrives against an unusually complicated macro backdrop.
August consumer inflation increased 0.4% month over month and 3.4% over the previous year. Core CPI increased 2.4% year over year. Gasoline prices were particularly important, rising 3.9% during August and accounting for more than one-third of the monthly increase in headline CPI.
At the same time, Treasury yields have moved substantially higher.
The 10-year Treasury yield was 4.97% on September 14, according to Federal Reserve daily interest-rate data. On September 15, market reporting showed the yield briefly reaching approximately 5.04%.
That combination matters because equity markets are simultaneously dealing with:
- persistent inflation
- elevated energy prices
- higher Treasury yields
- changing monetary-policy expectations
- geopolitical uncertainty
- high valuations in parts of the technology market
The result is an environment where a headline alone may not tell the entire story.
The market reaction to the headline may be more informative than the headline itself.
The Core Idea: Trade the Reaction, Not the Prediction
One of the most common mistakes around FOMC announcements is entering a position before the decision because the trader believes the outcome is already obvious.
A better research framework is:
Event → initial reaction → confirmation → continuation or reversal
This creates four separate questions.
- What did the Fed actually announce?
- How did Treasury yields react?
- Did the stock market move through an important technical level?
- Did the move survive the press conference?
The fourth question is especially important.
The initial statement and the press conference are separate information events.
A market that rallies immediately after the statement but gives back the entire move during the press conference is telling a very different story from a market that continues trending higher for several hours.
Strategy 1: The Post-FOMC Confirmation Breakout
The first strategy is deliberately simple.
Instead of trading immediately when the policy announcement hits, wait for the initial volatility to settle and establish a short post-event range.
For example, a research model could define:
- Event time: 2:00 p.m. ET
- Initial observation period: 15 minutes
- Confirmation range: high and low of the first 15-minute candle
- Entry condition: subsequent candle closes outside that range
- Confirmation: price remains outside the range
- Exit: predetermined time, technical invalidation, or volatility-based rule
The important element is the close outside the range, rather than merely a temporary price spike.
Why?
FOMC announcements can generate rapid liquidity gaps and reversals.
A price that trades above the initial high for several seconds is not necessarily a breakout.
A candle that closes above the level and remains above it provides a more testable definition.
Example
Suppose an index trades around 7,500 before the announcement.
After the decision:
- First 15-minute high = 7,545
- First 15-minute low = 7,465
A rules-based model does nothing while price remains between those levels.
If price later closes above 7,545, the model records an upside breakout.
If price closes below 7,465, it records a downside breakout.
The model does not need to predict the Fed.
It simply reacts to the market’s post-announcement decision.
Strategy 2: The Yield-Confirmation Filter
The second framework adds Treasury yields.
This is useful because an equity breakout can become less convincing when Treasury yields are moving aggressively in the opposite direction.
A simple research filter could classify the market into three states:
| Equity price | 10-year yield | Interpretation |
|---|---|---|
| Rising | Falling | Lower-rate confirmation |
| Falling | Rising | Higher-rate pressure |
| Rising | Rising | Mixed signal |
| Falling | Falling | Mixed signal |
This is not a prediction model.
It is a confirmation framework.
For example, if an equity index breaks above its post-FOMC range while the 10-year yield simultaneously falls, the move has one type of macro confirmation.
If the index breaks higher while Treasury yields surge, the same equity breakout may deserve separate treatment in a historical test.
The objective is to determine whether this filter improves the strategy’s historical robustness.
Strategy 3: The Failed Breakout Reversal
FOMC sessions are famous for false moves.
That creates a second type of setup that can be tested.
The model first identifies a breakout from the initial post-FOMC range.
It then asks whether the breakout fails.
A simple definition could be:
- Price closes above the initial range.
- Price subsequently returns inside the range.
- A candle closes back inside the range.
- The model classifies the original breakout as failed.
- A reversal signal is generated only after the failure condition is confirmed.
The same logic works on downside breaks.
The key distinction is that the strategy does not attempt to catch the first reversal tick.
It waits for evidence that the original breakout has failed.
That can substantially reduce the temptation to react emotionally to every fast move.
Strategy 4: The Time-Decay Filter
Not every FOMC move lasts all afternoon.
This creates an important backtesting question:
Does the strategy work better immediately after the announcement or later in the session?
A useful experiment is to divide the session into separate windows:
- 2:00–2:15 p.m. ET
- 2:15–2:30 p.m.
- 2:30–3:00 p.m.
- 3:00–3:30 p.m.
- 3:30–4:00 p.m.
Then calculate the performance of the same strategy in each window.
This can reveal whether the edge—if one exists—is concentrated around the announcement or persists through the press conference.
It also prevents a common backtesting mistake: treating the entire FOMC afternoon as one homogeneous period.
Why the Press Conference Changes the Setup
The policy statement is only part of the information flow.
The press conference can change expectations about:
- future policy
- inflation
- employment
- economic growth
- financial conditions
- the likely pace of future decisions
That means a strategy that enters at 2:05 p.m. may encounter an entirely different market regime at 2:35 p.m.
For this reason, FOMC strategies should record the statement period and press-conference period separately.
A useful dataset could contain:
| Variable | Example |
|---|---|
| Pre-FOMC price | 7,500 |
| 2:00 p.m. price | 7,530 |
| 15-minute high | 7,545 |
| 15-minute low | 7,465 |
| 2:30 p.m. price | 7,520 |
| 3:00 p.m. price | 7,560 |
| Closing price | 7,555 |
| 10Y yield before decision | 5.00% |
| 10Y yield after decision | 4.92% |
| Maximum favorable excursion | Measured |
| Maximum adverse excursion | Measured |
Once these variables are collected over many FOMC meetings, the strategy becomes researchable rather than anecdotal.
Options Add Another Layer of Complexity
Options traders face a different problem.
An expected large move can already be reflected in option premiums before the announcement.
Cboe recently highlighted how economic events can create sharp, news-driven moves and discussed strategies such as straddles, strangles and directional spreads around scheduled events.
The important lesson is that being right about volatility is not automatically enough.
Suppose an index option strategy pays a premium of $X.
The underlying must move sufficiently far to overcome the cost of that premium, depending on the structure and expiration.
Therefore, a backtest should measure:
- implied volatility before the event
- realized volatility after the event
- option premium
- bid-ask spread
- time to expiration
- entry timing
- exit timing
- volatility crush after the announcement
- transaction costs
A strategy that looks attractive using index-price movement alone may look very different after realistic option pricing assumptions.
A Simple FOMC Research Framework
For traders building systematic research, the entire process can be reduced to six steps.
Step 1: Define the event
Record every scheduled FOMC announcement date.
Do not manually select only the meetings that produced large moves.
Step 2: Define the pre-event reference
Record:
- previous close
- opening price
- price immediately before 2:00 p.m.
- Treasury yield
- implied volatility
- intraday range
Step 3: Define the event window
Choose one fixed methodology.
For example:
2:00–2:15 p.m. ET
Do not change the window after seeing the results.
Step 4: Define the signal
Examples include:
- breakout above the event range
- breakout below the event range
- failed breakout
- yield-confirmed breakout
- volatility expansion
Step 5: Define exits before testing
Potential research exits include:
- fixed percentage
- ATR-based target
- return to the event range
- end-of-day exit
- fixed time exit
- trailing stop
The important thing is consistency.
Step 6: Test out of sample
Divide the dataset into:
- development period
- validation period
- out-of-sample period
If a strategy only works after repeatedly changing its parameters, the apparent edge may simply be overfitting.
What a Good FOMC Backtest Should Measure
Win rate is only one metric.
A serious analysis should also calculate:
Average trade
How much did each trade make or lose on average?
Profit factor
How much gross profit was generated relative to gross loss?
Maximum drawdown
What was the largest peak-to-trough decline?
Expectancy
What was the average expected result per trade?
MAE
How far did trades move against the strategy before eventually becoming profitable?
MFE
How far did profitable trades move in the favorable direction?
Trade duration
How long did positions typically remain open?
Regime sensitivity
Did the strategy work during both low- and high-volatility FOMC periods?
That last measurement is particularly important.
A strategy that works only when the market is extremely volatile may not represent a durable trading edge.
Avoid the Biggest FOMC Backtesting Mistakes
Look-ahead bias
Do not use information that became available after the signal.
For a 2:05 p.m. entry, the model cannot use the 2:30 p.m. press conference.
Survivorship bias
If the strategy uses individual stocks, make sure historical testing includes securities that later disappeared, merged or were removed from an index where appropriate.
Slippage
FOMC announcements can produce unusually fast markets.
Using the closing price as if every trader could obtain it can materially distort results.
Transaction costs
Include commissions where applicable, exchange and regulatory costs where relevant, spreads and execution slippage.
Overfitting
Do not optimize ten variables simply because the initial strategy did not work.
The more degrees of freedom introduced into a model, the easier it becomes to fit historical noise.
A Better Way to Compare FOMC Strategies
Rather than asking which strategy produced the highest historical return, compare them across several dimensions.
| Metric | Breakout | Failed Breakout | Yield Filter | Time Filter |
|---|---|---|---|---|
| Total trades | — | — | — | — |
| Win rate | — | — | — | — |
| Profit factor | — | — | — | — |
| Max drawdown | — | — | — | — |
| Average trade | — | — | — | — |
| Median trade | — | — | — | — |
| Average duration | — | — | — | — |
| Out-of-sample result | — | — | — | — |
The blanks are intentional.
A research framework should not assume which strategy will win before the data are tested.
That is the difference between a trading hypothesis and a trading system.
What Traders Should Watch on September 16
Today’s market provides several variables worth monitoring regardless of the eventual policy decision.
1. The 10-year Treasury yield
The yield recently approached and briefly exceeded the psychologically important 5% level.
A sustained move in yields can change the valuation environment for equities.
2. Oil prices
Energy prices remain an important inflation variable.
A renewed oil rally could complicate the market’s interpretation of any policy decision.
3. Equity breadth
A headline index move is less informative if only a small number of large stocks are responsible for the gain.
A stronger confirmation signal would involve broader participation.
4. Volatility
Cboe reported that SPX weekly options were pricing approximately a 1.1% implied move around the September 16 announcement.
The research question is therefore not simply whether the market moves.
It is whether the realized move is large enough, persistent enough and clean enough to justify the strategy’s assumed execution costs.
5. The press conference
The 2:30 p.m. ET press conference creates a second information event.
A strategy should explicitly decide whether it:
- exits before the press conference
- holds through it
- treats the press conference as a separate trading window
Mixing these approaches can make historical results difficult to interpret.
The BacktestCart FOMC Playbook
A practical systematic framework can therefore look like this:
Before the decision
Record volatility, Treasury yields, oil and the pre-event range.
At 2:00 p.m. ET
Do not assume the first price reaction is the final direction.
First 15 minutes
Create a fixed event range.
After the initial range
Wait for a confirmed breakout or confirmed failed breakout according to predefined rules.
At 2:30 p.m. ET
Treat the press conference as a new information event.
During the remainder of the session
Track whether the original move persists or reverses.
After the close
Record the complete event path rather than only the final return.
That final point is critical.
Two FOMC sessions can both finish +0.5%, yet have completely different intraday paths.
One might rally steadily.
Another might fall 1.5%, reverse sharply, and finish +0.5%.
A closing-price-only backtest would treat them as nearly identical.
A market-event strategy should not.
The Bigger Lesson
FOMC trading is less about guessing the Federal Reserve and more about controlling the research process.
The market receives information at known times.
That creates an opportunity to define standardized windows, signals, confirmation rules and exits.
But it also creates unusual execution risk.
Large moves, widening spreads, fast reversals and changing volatility can make a strategy appear much better in historical data than it would be in live execution.
The most useful FOMC strategy, therefore, is not necessarily the one with the highest historical return.
It is the one whose logic remains understandable when assumptions are changed.
Test different event windows.
Test different volatility regimes.
Test transaction costs.
Test slippage.
Test out-of-sample periods.
Then test the strategy again without changing the rules simply because one particular FOMC meeting produced an unusual result.
That is how an event-driven trading idea becomes a research framework rather than a one-day market story.
Explore Backtested Trading Data
Research historical trading results for U.S. stocks and ETFs using systematic backtested market data.
Explore Backtested Data →Frequently Asked Questions
What is the best strategy for trading an FOMC announcement?
There is no universally best FOMC strategy. Breakouts, failed-breakout reversals, volatility strategies and yield-confirmation systems represent different hypotheses. Their usefulness depends on the market, timeframe, execution assumptions and historical sample.
Why are FOMC days difficult to trade?
FOMC sessions can contain multiple information events. The initial policy statement may move prices in one direction while the press conference changes expectations again. Volatility and execution conditions can also change rapidly.
Should a trader enter immediately when the Fed announces its decision?
A systematic approach does not have to enter immediately. Waiting for a predefined confirmation period can reduce exposure to the initial headline-driven price spike. Whether this improves results should be tested rather than assumed.
How can FOMC strategies be backtested?
Start with every historical FOMC announcement, define the event window in advance, establish objective entry and exit rules, include realistic costs and slippage, and separate development results from out-of-sample results.
Why should Treasury yields be included in an equity trading strategy?
Treasury yields influence financial conditions and equity valuation. Comparing equity price action with Treasury-yield movement can provide an additional confirmation variable, although the relationship is not constant.
Are options useful for FOMC trading?
Options can provide ways to express views on direction or volatility, but premiums, implied volatility, time decay, spreads and post-event volatility changes must be included in the analysis. A large underlying move does not automatically produce a profitable options trade.
Key Takeaways
- FOMC sessions should be treated as structured event windows rather than ordinary trading days.
- The initial market reaction does not necessarily establish the full-session trend.
- Post-event breakout and failed-breakout rules can be tested systematically.
- Treasury yields can be used as a confirmation variable.
- The 2:30 p.m. ET press conference should be treated as a separate information event.
- Options strategies require volatility, premium, spread and time-decay assumptions.
- Backtests should include slippage, transaction costs, drawdown and out-of-sample testing.
- The goal is not to predict the Fed but to build a repeatable response to market behavior.
Conclusion
The September 16 FOMC decision provides a useful real-world laboratory for event-driven trading research.
With inflation still elevated, Treasury yields recently testing 5% and oil prices adding another source of uncertainty, today’s session has several interacting market variables.
For systematic traders, the interesting question is not simply whether stocks rise or fall after the announcement.
It is whether a clearly defined set of rules can identify the difference between a genuine breakout, a failed move and a temporary volatility spike.
That question can be answered with data.
And once the rules are defined before looking at the outcome, FOMC trading becomes a research problem rather than a prediction contest.
Educational disclaimer: This article is for market research and educational purposes only. It does not constitute personalized investment advice, a recommendation to buy or sell securities, or a guarantee of trading results. Historical backtest performance does not guarantee future results. Actual execution can differ materially because of spreads, slippage, liquidity, commissions and market conditions.