
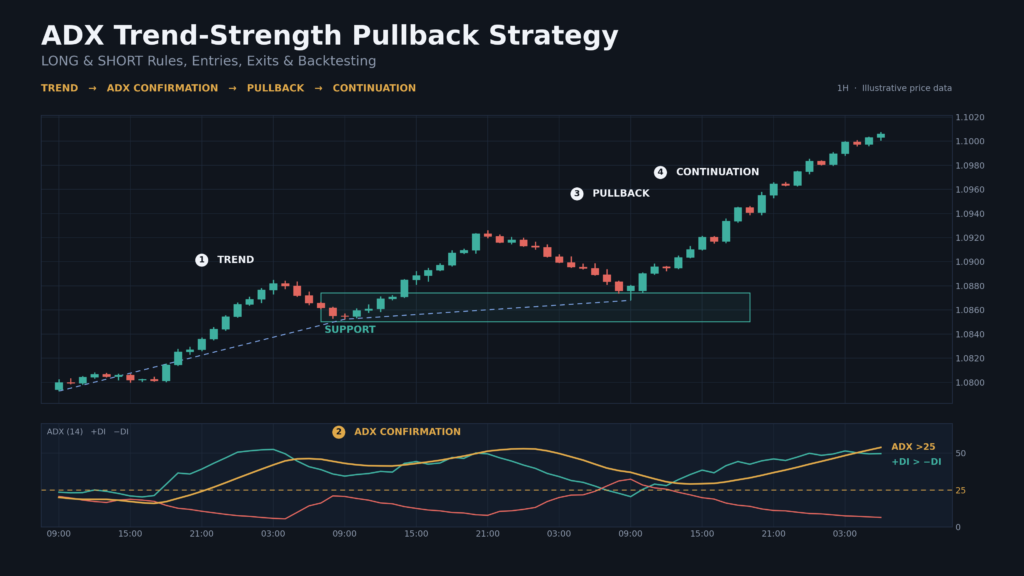
How to use ADX with price structure, directional movement, pullbacks, confirmation, risk management, and systematic backtesting
A common problem with trend-following strategies is knowing whether the market is actually trending strongly enough to justify a continuation trade.
The Average Directional Index (ADX) was designed to measure trend strength, not trend direction. That distinction is important.
ADX can tell you that directional movement is becoming stronger, but it does not independently tell you whether buyers or sellers are in control.
This article develops a rules-based ADX Trend-Strength Pullback Strategy that combines:
Market Structure → ADX Trend Strength → Pullback → Directional Confirmation → Entry → Risk Management → Exit
The framework can be applied to both BUY/LONG and SELL/SHORT setups and can be systematically backtested.
Educational disclaimer: This is an educational trading framework, not a promise of profitability or investment advice. Historical and illustrative results do not guarantee future performance.
1. What Is ADX?
The Average Directional Index (ADX) is a technical indicator designed to measure the strength of a trend.
It is commonly displayed together with:
- ADX
- +DI
- −DI
A traditional configuration is:
ADX period = 14
The three components have different purposes.
ADX
Measures trend strength.
+DI
Represents positive directional movement.
−DI
Represents negative directional movement.
The critical point is:
ADX measures strength; +DI and −DI help provide directional context.
A rising ADX does not automatically mean price is going up.
ADX can rise during a powerful bearish trend as well.
2. Why ADX Can Be Useful
Many trading systems perform differently depending on market regime.
A trend-following setup may work reasonably well when:
Price → Higher High → Higher Low → Higher High
But the same setup can struggle when price repeatedly oscillates inside a narrow range.
ADX can be used as a trend-strength filter.
Instead of taking every pullback, the trader can ask:
Is directional movement strong enough to justify considering a continuation trade?
This makes ADX particularly useful as a filter rather than a standalone entry signal.
3. Standard ADX Configuration
For initial testing, use:
ADX Period: 14
Display:
- ADX
- +DI
- −DI
A trader can begin research with thresholds such as:
ADX below 20: weak/limited trend strength
ADX above 20: potentially developing trend
ADX above 25: stronger trend environment
These values are not universal laws.
They should be treated as research parameters and tested for the market and timeframe being studied.
4. The Core Strategy
The strategy follows this sequence:
LONG
Bullish Structure
↓
ADX Indicates Sufficient Trend Strength
↓
Price Pulls Back
↓
+DI Remains Dominant / Recovers
↓
Bullish Price Confirmation
↓
LONG Entry
↓
Structural Stop
↓
Predefined Exit
SHORT
Bearish Structure
↓
ADX Indicates Sufficient Trend Strength
↓
Price Retraces
↓
−DI Remains Dominant / Recovers
↓
Bearish Price Confirmation
↓
SHORT Entry
↓
Structural Stop
↓
Predefined Exit
5. Identifying a Bullish Market Structure
Before using ADX, examine price itself.
A bullish environment generally shows:
Higher High → Higher Low → Higher High
For example:
- Swing Low: ₹100
- Swing High: ₹110
- Pullback Low: ₹104
- New High: ₹114
The higher low suggests that buyers are still defending the broader structure.
ADX can then be used to determine whether directional strength supports a continuation setup.
6. Identifying a Bearish Market Structure
A bearish environment generally shows:
Lower Low → Lower High → Lower Low
Example:
- Swing High: ₹120
- Swing Low: ₹110
- Retracement High: ₹116
- New Low: ₹106
This establishes a bearish structure.
The strategy then looks for a controlled retracement rather than chasing price after an extended decline.
7. BUY/LONG Setup
The LONG strategy can be defined using the following rules.
Rule 1 — Bullish structure
Price must demonstrate a meaningful higher-high/higher-low structure.
Rule 2 — ADX strength
ADX should meet the predefined threshold used in the backtest.
For an initial research model:
ADX > 25
can be tested.
Do not assume that 25 is universally optimal.
Rule 3 — Directional confirmation
Prefer:
+DI > −DI
This establishes bullish directional dominance.
Rule 4 — Wait for a pullback
Price should retrace toward a meaningful area such as:
- Previous breakout level
- Support
- Previous swing zone
- Moving-average area
Rule 5 — Pullback remains structurally valid
The pullback should not decisively destroy the bullish structure.
Rule 6 — Price confirmation
Possible objective trigger:
Price breaks above the pullback high.
A bullish rejection candle can provide additional confirmation.
Rule 7 — LONG Entry
Enter above the predefined confirmation candle or pullback high.
Rule 8 — Stop
Place the stop below the structural invalidation level.
Rule 9 — Target
Use a predefined tested exit method.
For example:
2R
or:
next major resistance
or:
trailing stop
8. SELL/SHORT Setup
The SHORT framework is symmetrical.
Rule 1 — Bearish structure
Price must show:
Lower Low + Lower High
Rule 2 — ADX strength
ADX should exceed the predefined threshold.
For example:
ADX > 25
can be tested.
Rule 3 — Directional confirmation
Prefer:
−DI > +DI
Rule 4 — Wait for retracement
Price should retrace toward:
- Previous breakdown level
- Resistance
- Previous swing zone
- Moving-average area
Rule 5 — Structure remains bearish
The retracement should not decisively invalidate the bearish structure.
Rule 6 — Price confirmation
For example:
Price breaks below the retracement low.
Rule 7 — SHORT Entry
Enter below the bearish confirmation candle or retracement low.
Rule 8 — Stop
Place the stop above the structural invalidation point.
Rule 9 — Target
Use a predefined tested exit method such as:
2R
or:
next major support
or:
trailing stop
9. ADX Should Not Be Used as a Direction Indicator
This is one of the most important concepts.
Suppose:
ADX = 35
That does not mean:
BUY
It means the market is showing relatively strong directional movement.
You still need to determine whether:
+DI > −DI
or:
−DI > +DI
and, more importantly, whether price structure agrees.
A strong bearish trend can have a very high ADX.
Therefore:
ADX answers “How strong is the trend?” rather than simply “Which direction should I trade?”
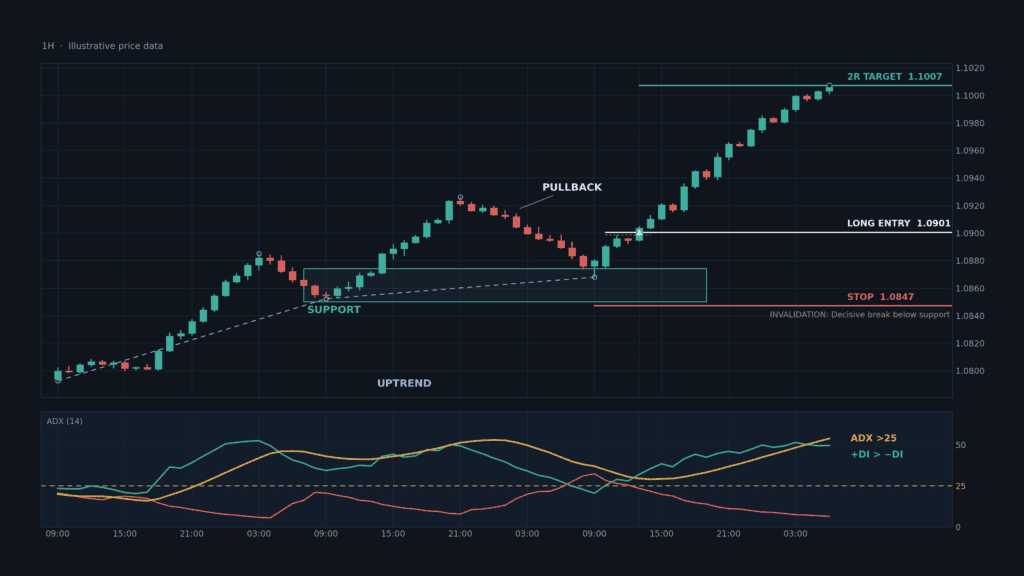
10. Entry & Exit Rules + Chart Visuals
BUY/LONG Rules
A valid LONG setup requires:
- Bullish market structure.
- ADX above the predefined strength threshold.
- +DI above −DI.
- Controlled price pullback.
- Pullback holds a meaningful structural area.
- Price breaks above the pullback high.
- LONG entry occurs according to the predefined trigger.
- Stop is placed below structural invalidation.
- Position size is calculated from maximum permitted risk.
- Exit follows the predefined backtested method.
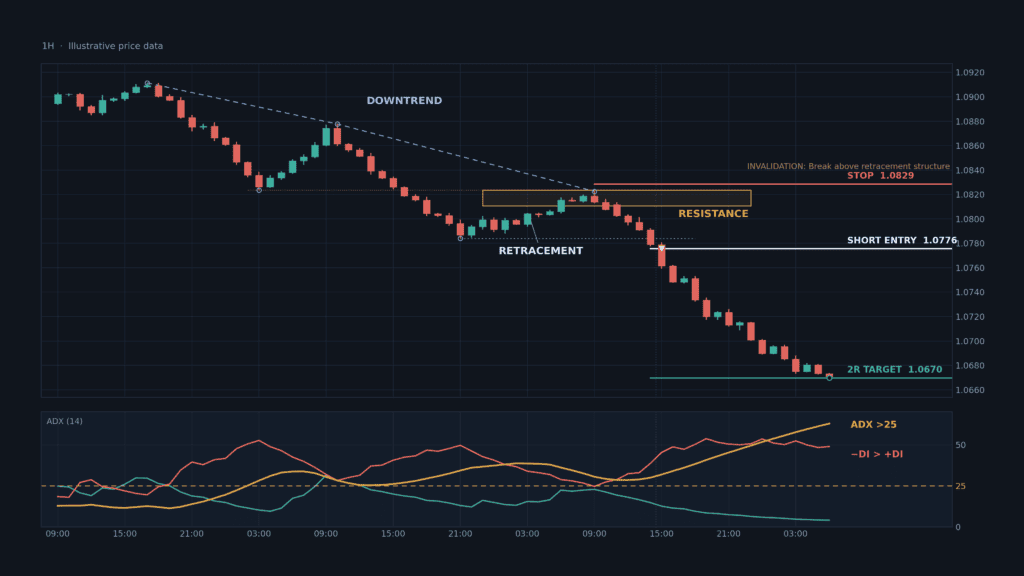
SELL/SHORT Rules
A valid SHORT setup requires:
- Bearish market structure.
- ADX above the predefined strength threshold.
- −DI above +DI.
- Controlled price retracement.
- Retracement reaches meaningful resistance.
- Price breaks below the retracement low.
- SHORT entry occurs according to the predefined trigger.
- Stop is placed above structural invalidation.
- Position size is calculated from predefined risk.
- Exit follows the tested strategy rule.
11. Why the Pullback Is Important
Entering immediately when ADX rises above a threshold can create poor entries.
Consider:
Price rises sharply → ADX increases → trader buys → price retraces
The problem is that momentum may already be extended.
A pullback approach waits for:
Trend → Pullback → Confirmation → Continuation
This can create a more clearly defined invalidation level.
12. Example LONG Trade
Suppose an instrument has:
Higher High = ₹210
Then price pulls back toward:
₹202 support
ADX:
28
+DI remains above −DI.
Price forms a bullish rejection and breaks above the pullback high at:
₹206
Illustrative trade:
Entry = ₹207
Stop = ₹202
Risk:
₹5
At 2R:
Target = ₹217
These prices are illustrative only.
The important sequence is:
Bullish Structure → ADX Strength → Pullback → Support → Confirmation → LONG
13. Example SHORT Trade
Suppose:
Lower Low = ₹190
Price retraces toward:
₹198 resistance
ADX:
31
−DI remains above +DI.
Price rejects resistance and breaks below the retracement low at ₹194.
Illustrative trade:
Entry = ₹193
Stop = ₹198
Risk:
₹5
At 2R:
Target = ₹183
Again, these prices are purely illustrative.
14. Risk Management
Suppose trading capital is:
₹5,00,000
Maximum risk per trade:
1%
Maximum permitted loss:
₹5,000
If:
Entry = ₹207
Stop = ₹202
Risk per share:
₹5
Position size:
₹5,000 ÷ ₹5 = 1,000 shares
Formula
Position Size = Maximum Permitted Risk ÷ Risk Per Share
The position should also be adjusted for liquidity and execution constraints.
15. Risk-to-Reward
If:
Entry = ₹207
Stop = ₹202
Risk = ₹5
Then a 2R target is:
₹217
This provides an objective framework for evaluating the trade before entry.
The target itself is not a prediction.
16. When ADX Can Mislead
ADX has several important limitations.
ADX can rise during a bearish trend
A rising ADX does not mean price is rising.
ADX can remain elevated after momentum begins weakening
Trend strength and future price direction are not identical.
ADX can remain low during long consolidations
This may keep a trend strategy inactive for extended periods.
ADX thresholds are market-dependent
An ADX value of 25 may behave differently across instruments and timeframes.
Therefore, thresholds should be treated as testable parameters rather than universal rules.
17. Avoiding Choppy Markets
A trend-following system is vulnerable when price oscillates around a range.
Typical sequence:
Bullish Signal → Reversal → Bearish Signal → Reversal
ADX can help filter some weak conditions, but it cannot eliminate all false signals.
A useful framework is:
Price Structure + ADX + Directional Movement
rather than:
ADX alone
18. Optional Volume Confirmation
Volume can provide additional information.
For LONG:
Pullback → Lower/normal volume
followed by:
Breakout → Higher volume
For SHORT:
Retracement → Normal volume
followed by:
Breakdown → Higher volume
This can be tested as an optional filter.
Do not assume that volume automatically improves the strategy until it is demonstrated in the data.
19. Exit Method 1 — Fixed R Multiple
A simple approach is:
Stop = 1R
Target = 2R
Advantages:
- Objective
- Easy to backtest
- Easy to calculate expectancy
- Removes discretionary exits
Disadvantage:
A strong trend may continue well beyond 2R.
20. Exit Method 2 — Market Structure
For a LONG:
Exit near the next meaningful resistance.
For a SHORT:
Exit near the next meaningful support.
This may align the exit more closely with price structure.
However, it introduces more subjectivity unless levels are defined objectively.
21. Exit Method 3 — Trailing Stop
A trailing method can attempt to capture longer trends.
For example:
LONG:
Trail below successive higher lows
SHORT:
Trail above successive lower highs
This may reduce the frequency of early exits but can also give back more open profit.
It must be backtested independently.
22. When NOT to Trade
Consider skipping or separately classifying setups when:
- Market structure is unclear
- ADX is below the tested threshold
- +DI and −DI repeatedly cross
- Price is trapped inside a narrow range
- Entry occurs directly into major support/resistance
- Stop distance is unusually large
- Risk/reward is poor
- A major scheduled event makes execution conditions abnormal
- The setup requires subjective interpretation that cannot be consistently reproduced
23. Backtesting Methodology
The biggest advantage of this strategy is that most components can be converted into objective rules.
Step 1 — Define the timeframe
Example:
1-hour
Do not switch timeframes selectively after seeing results.
Step 2 — Define ADX parameters
Start with:
ADX 14
Step 3 — Define trend structure
Create objective rules for identifying:
- Higher highs
- Higher lows
- Lower highs
- Lower lows
Step 4 — Define ADX threshold
Test values such as:
20, 25, 30
as separate configurations.
Do not select the best value solely because it produced the highest historical return.
Step 5 — Define directional condition
LONG:
+DI > −DI
SHORT:
−DI > +DI
Step 6 — Define pullback
Specify exactly what qualifies as a pullback.
Step 7 — Define entry
For example:
LONG:
Break above pullback high
SHORT:
Break below retracement low
Step 8 — Define stop
Use structural invalidation.
Step 9 — Define exit
Test:
- 1.5R
- 2R
- 3R
- Structure exit
- Trailing exit
separately.
Step 10 — Include realistic costs
Account for:
- Brokerage
- Spread
- Slippage
- Taxes/fees
- Execution assumptions
24. Backtesting Metrics
Measure:
| Metric | Why It Matters |
|---|---|
| Number of trades | Sample size |
| Win rate | Frequency of winners |
| Average win | Typical gain |
| Average loss | Typical loss |
| Profit factor | Gross profit vs gross loss |
| Expectancy | Average outcome |
| Maximum drawdown | Capital risk |
| Consecutive losses | Psychological pressure |
| LONG performance | Directional edge |
| SHORT performance | Directional edge |
| ADX regime | Threshold robustness |
| Market regime | Strategy stability |
| Costs | Real-world viability |
“`html
Take Your Trading Research Further
Explore the BacktestCart store for available trading resources, research materials and educational products to support your trading journey.
Explore the BacktestCart Store ↗Visit our store to explore available resources.
25. Expectancy Example
Suppose:
Win rate = 44%
Average winner:
2R
Average loser:
1R
Then:
Expectancy = (0.44 × 2R) − (0.56 × 1R)
= 0.88R − 0.56R
= +0.32R
This is an illustrative mathematical example, not an expected result from this strategy.
26. Parameter Testing Without Overfitting
Suppose you test ADX thresholds:
- 20
- 22
- 25
- 27
- 30
If 25 produces dramatically better results than every neighboring value, investigate whether the result is stable.
A more robust strategy often performs reasonably across a range of nearby parameters, rather than only one highly optimized setting.
27. Out-of-Sample Testing
Separate your dataset into:
Development data
Used to establish the rules.
Validation data
Used to evaluate the rules on unseen observations.
Forward testing
Used to assess how the strategy behaves without continuously modifying it.
The goal is to determine whether the edge survives outside the data that inspired the strategy.
28. Walk-Forward Analysis
A stronger testing framework can use:
Development → Test → Move Forward → Test Again
This helps evaluate whether the strategy remains functional across:
- Trending markets
- Sideways markets
- High-volatility markets
- Low-volatility markets
A strategy that works only in one historical period deserves additional scrutiny.
29. Common Mistakes
Mistake 1 — Treating ADX as a BUY signal
ADX measures strength, not direction.
Mistake 2 — Ignoring +DI and −DI
Directional context matters.
Mistake 3 — Buying after an already extended move
A high ADX can appear after a large move has already occurred.
Mistake 4 — Ignoring market structure
Indicator signals should be interpreted alongside price.
Mistake 5 — Optimizing the threshold excessively
The best historical ADX threshold may simply be the result of overfitting.
Mistake 6 — Moving the stop
If structural invalidation occurs, increasing risk does not restore the original setup.
Mistake 7 — Ignoring transaction costs
Frequent entries can make trading costs significant.
30. Practical Trading Checklist
LONG
☐ Bullish market structure
☐ ADX above predefined threshold
☐ +DI > −DI
☐ Controlled pullback
☐ Support identified
☐ Pullback structure intact
☐ Break above pullback high
☐ Entry predefined
☐ Stop predefined
☐ Target predefined
☐ Risk/reward acceptable
☐ Position size calculated
SHORT
☐ Bearish market structure
☐ ADX above predefined threshold
☐ −DI > +DI
☐ Controlled retracement
☐ Resistance identified
☐ Bearish structure intact
☐ Break below retracement low
☐ Entry predefined
☐ Stop predefined
☐ Target predefined
☐ Risk/reward acceptable
☐ Position size calculated
31. Strategy Decision Flow
Identify Market Structure
↓
ADX Above Tested Threshold?
→ NO → WAIT
→ YES
↓
Directional Bias Confirmed?
LONG: +DI > −DI
SHORT: −DI > +DI
↓
Controlled Pullback/Retracement?
→ NO → WAIT
→ YES
↓
Structural Level Holds?
→ NO → SKIP
→ YES
↓
Price Confirmation?
→ NO → WAIT
→ YES
↓
Risk/Reward Acceptable?
→ NO → SKIP
→ YES
↓
Calculate Position Size
↓
Enter
↓
Monitor Invalidation
↓
Exit According to Tested Rule
Continue Your Trading Research
Explore more trading strategies, technical analysis, backtesting methods and market insights.
Final Takeaway
The ADX Trend-Strength Pullback Strategy is not about buying simply because ADX rises.
The complete framework is:
Market Structure → ADX Strength → Directional Confirmation → Pullback → Price Confirmation → Entry → Structural Risk → Tested Exit
For LONG trades, the framework looks for:
Bullish structure + ADX strength + +DI dominance + bullish continuation
For SHORT trades:
Bearish structure + ADX strength + −DI dominance + bearish continuation
The most important part is to turn these concepts into objective rules.
Before using the strategy with real capital, test:
- ADX thresholds
- Timeframes
- Pullback definitions
- Entry methods
- Stop methodologies
- Exit methods
- LONG vs SHORT performance
- Market regimes
- Transaction costs
- Maximum drawdown
A strategy that survives out-of-sample testing and realistic cost assumptions is more informative than one that simply looks attractive on a handful of historical charts.