
Introduction
Successful trading is not simply about identifying whether a stock might rise or fall. A repeatable trading process also needs rules for recognizing market conditions, confirming an entry, defining invalidation, calculating position size, and evaluating the results.
One way to structure this process is to combine exponential moving averages, or EMAs, with the Relative Strength Index (RSI) and trading volume.
The 20/50 EMA Pullback Strategy presented in this article is designed to identify potential continuation trades in liquid US-listed stocks and exchange-traded funds (ETFs).
Its central idea is straightforward:
- Use the 20 EMA and 50 EMA to identify the prevailing trend.
- Wait for price to pull back rather than chase an extended move.
- Use RSI to assess whether momentum is consistent with the proposed trade.
- Use volume to help evaluate the strength of a potential entry.
- Define the entry, stop-loss, target, and maximum risk before placing an order.
The strategy includes separate BUY/LONG and SELL/SHORT rules.
Importantly, these are proposed trading rules for research and testing—not a claim that the strategy has demonstrated profitability. The parameters have not been presented as results from a completed historical backtest.
A strategy that appears logical on a chart may perform poorly after transaction costs, slippage, changing market conditions, and execution limitations are considered.
The objective is to build a framework that can be tested objectively rather than relying on subjective chart interpretation.
Who Should Consider Studying This Strategy?
This framework may be useful for traders who:
- Prefer trading in the direction of a defined intraday trend.
- Want to avoid buying every bullish candle or shorting every bearish candle.
- Need explicit long and short entry conditions.
- Want to incorporate indicators without treating them as infallible signals.
- Are willing to collect historical data and evaluate performance before committing capital.
It may be less suitable for traders who prefer very short scalping timeframes, discretionary news trading, or strategies based on predicting sudden market reversals.
1. Understanding the Four Components
Before combining the indicators, it is important to understand the role each one plays.
A. The 20-Period Exponential Moving Average
The 20 EMA gives greater weight to recent prices than a simple moving average of the same length.
On a five-minute chart, it reflects recent price behavior across approximately 20 bars, although its calculation gives more importance to newer observations.
In this strategy, the 20 EMA serves as a reference for identifying pullbacks within a potential trend.
When price advances, pauses, and approaches the 20 EMA, a trader can examine whether the pullback is stabilizing or whether selling pressure is becoming stronger.
What it does not tell you: Price touching the 20 EMA does not automatically create a trading opportunity. In sideways markets, price may repeatedly cross the average and generate misleading signals.
B. The 50-Period Exponential Moving Average
The 50 EMA provides a slower reference for the broader intraday trend.
This strategy uses the relationship between the two averages:
- Bullish condition: The 20 EMA is above the 50 EMA, and the 50 EMA is rising.
- Bearish condition: The 20 EMA is below the 50 EMA, and the 50 EMA is falling.
- Unclear condition: The averages are flat, frequently crossing, or moving in conflicting directions.
The averages are used as a trend filter rather than as automatic entry signals.
A bullish EMA arrangement can persist during a decline, and a bearish arrangement can remain in place during a recovery. That is why the strategy also requires a pullback, momentum confirmation, and a defined entry trigger.
C. The Relative Strength Index
The RSI is a momentum indicator that generally ranges between 0 and 100.
Traditional RSI analysis often emphasizes readings above 70 and below 30. However, this strategy uses different ranges to evaluate momentum during a pullback.
For the long setup, RSI should remain consistent with bullish momentum and turn upward as price begins recovering.
For the short setup, RSI should remain consistent with bearish momentum and turn downward after a recovery attempt.
The strategy uses RSI as a confirmation tool—not as a standalone overbought or oversold signal.
An RSI reading above 70 does not necessarily mean a stock must fall. Similarly, an RSI reading below 30 does not guarantee an immediate recovery.
D. Trading Volume
Volume measures the number of shares traded during a specified period.
An increase in volume during a potential entry can indicate greater participation, but it does not prove that the move will continue.
This strategy uses a relative-volume threshold to avoid accepting a signal candle with unusually weak participation compared with recent bars.
For reproducibility, the example rules compare the signal candle’s volume with the average volume of the previous 20 completed five-minute bars.
This is a simple, testable rule. It is not a universal definition of strong volume, and its usefulness must be evaluated empirically.
2. The Complete Strategy: Rules and Indicator Settings
Strategy Configuration
| Component | Specification |
|---|---|
| Market | US-listed stocks and ETFs |
| Chart timeframe | 5 minutes |
| Trading session | Regular US session |
| 20 EMA | Trend-pullback reference |
| 50 EMA | Trend filter |
| RSI | 14-period |
| ATR | 14-period |
| Volume average | 20 completed bars |
| Minimum relative volume | 1.2× previous 20-bar average |
| Primary trade type | Trend continuation |
| Direction | Long or short |
| Initial profit target | 2R |
| Maximum planned risk | 0.25% of account equity per trade |
| Maximum daily loss | 0.5% of starting daily equity |
| Maximum trades | 3 per day |
| New-entry window | 9:45 a.m.–3:00 p.m. Eastern Time |
| Planned end-of-day exit | By 3:50 p.m. Eastern Time |
The NYSE’s regular core session runs from 9:30 a.m. to 4:00 p.m. Eastern Time on normal trading days. The strategy avoids new entries during the opening 15 minutes and does not initiate trades after 3:00 p.m. ET. Exchange holidays and early-close schedules must be checked before each trading day.
All times in this article refer to Eastern Time.
Stock and ETF Selection
To keep the strategy focused on relatively liquid securities, the following screening thresholds can be used as initial research assumptions:
- US-listed common stocks or ETFs.
- Share price of at least $10.
- Average daily dollar volume of at least $50 million over the preceding 20 sessions.
- A reasonably tight bid-ask spread.
- Sufficient historical five-minute data for testing.
These are proposed screening thresholds, not exchange requirements or proven optimal values.
Avoid securities with unusual trading halts, extremely wide spreads, or unreliable data.
For individual stocks, a conservative implementation can exclude scheduled earnings-release days. High-impact US economic announcements should also be identified in advance. A strategy that trades through these events should be tested separately because price behavior and execution conditions may differ substantially.
Indicator Calculation Rules
Use the following settings consistently:
- EMA 20 calculated from closing prices.
- EMA 50 calculated from closing prices.
- RSI 14 calculated using a consistent standard RSI implementation.
- ATR 14 calculated using a consistent standard ATR implementation.
- Volume SMA 20 calculated from the previous 20 completed bars, excluding the current signal bar.
The current signal candle must be complete before its closing price, RSI, volume, or other values are used to confirm the setup.
This prevents a backtest from accidentally using information that would not have been available at the decision point.
3. BUY/LONG Setup: The Bullish EMA Pullback
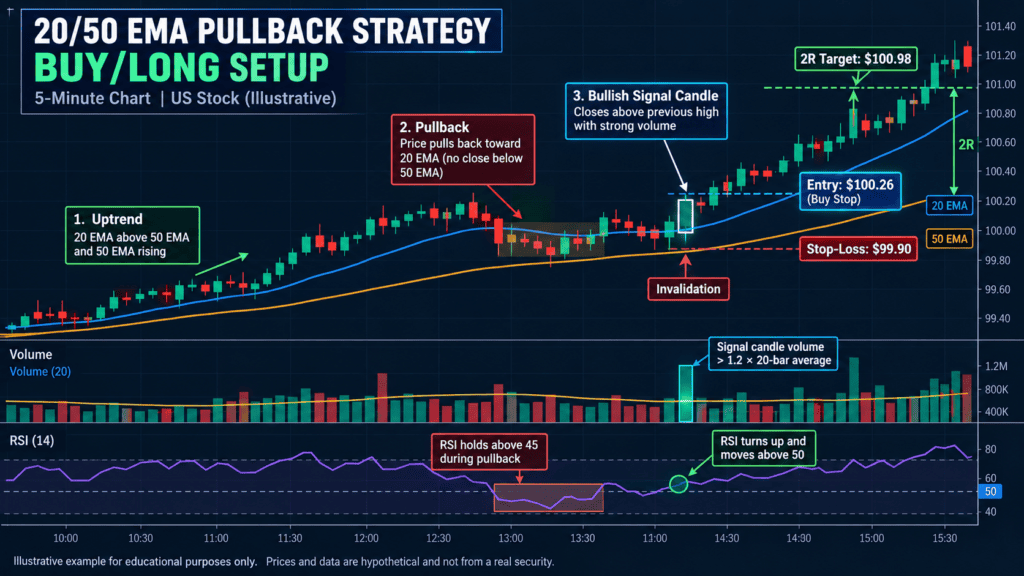
The bullish setup looks for a potential continuation after a stock advances, pulls back toward the 20 EMA, and begins recovering.
The aim is to avoid buying merely because a stock has risen. Instead, the trader waits for a specific sequence of conditions.
Step 1: Confirm the Bullish Trend
All the following conditions must be satisfied:
- The 20 EMA is above the 50 EMA.
- The current 50 EMA is higher than its value three completed bars earlier.
- At least three of the previous four completed candles closed above the 50 EMA.
- The stock has not shown a recent, decisive breakdown below the 50 EMA.
These conditions define the trend filter.
If the averages are flat or repeatedly crossing, skip the trade.
Step 2: Identify a Valid Pullback
Wait for price to move back toward the 20 EMA.
The pullback must satisfy these conditions:
- At least one of the previous three completed candles has a low within 0.20 ATR of the 20 EMA.
- No candle during the pullback closes below the 50 EMA.
- The pullback produces a recognizable local low.
- Price does not extend so far below the 20 EMA that the trend-continuation idea is no longer attractive.
The 0.20 ATR tolerance is an explicit research parameter. It should be tested rather than assumed to be optimal.
The strategy does not require price to touch the 20 EMA exactly.
Step 3: Confirm RSI Behavior
During the pullback, RSI should remain between 45 and 65.
The signal candle must then satisfy both conditions:
- RSI is above 50.
- RSI is higher than its value on the previous completed candle.
This rule is intended to identify a recovery in momentum while avoiding an extremely extended RSI reading.
It does not guarantee that bullish momentum will continue.
Step 4: Confirm the Signal Candle
The signal candle must:
- Close above the previous candle’s high.
- Close above its own opening price.
- Have volume at least 1.2 times the average volume of the previous 20 completed bars.
- Close above the 20 EMA.
All conditions must be met on the same completed signal candle.
If one condition is missing, the trade is not valid under this version of the strategy.
Step 5: Define the Entry
Place a buy-stop entry trigger one minimum price increment above the signal candle’s high.
For a stock with a $0.01 minimum price increment, this means placing the trigger $0.01 above the signal high.
The entry is valid only if triggered within the next three completed five-minute bars.
If the trigger is not reached within that window, cancel the setup.
If the opening price of a new candle jumps above the planned entry, do not assume a fill at the original trigger price. Use a realistic executable price and recalculate the risk-to-reward ratio before accepting the trade.
Step 6: Calculate the Stop-Loss
Identify the lowest low of the five completed candles ending with the signal candle.
Set the stop-loss below that low by the greater of:
- 0.10 ATR; or
- One minimum price increment.
The stop must be placed at a level where the trade idea is invalidated, not at an arbitrary distance chosen to make the position size larger.
Calculate the initial risk per share:
Initial risk per share = Entry price − Stop-loss price
Reject the trade if the stop distance is less than 0.25 ATR or greater than 1.50 ATR.
This additional filter prevents the strategy from accepting extremely tight stops or unusually wide risk distances under its initial configuration.
Step 7: Set the Profit Target
Use a target equal to twice the initial risk.
Target price = Entry price + 2 × Initial risk per share
For example, if the entry is $100.00 and the stop is $99.60:
- Initial risk per share: $0.40.
- Target at 2R: $100.80.
The target is a predefined exit level, not a prediction.
Step 8: Exit the Trade
Exit the long position when any of the following occurs:
- The stop-loss is triggered.
- The 2R profit target is reached.
- The position reaches the scheduled end-of-day exit.
Do not widen the stop-loss after entry.
For a conservative historical simulation, if the stop and target are both touched within the same five-minute candle and the sequence cannot be established from finer-grained data, assume the stop was reached first.
This avoids artificially favorable results.
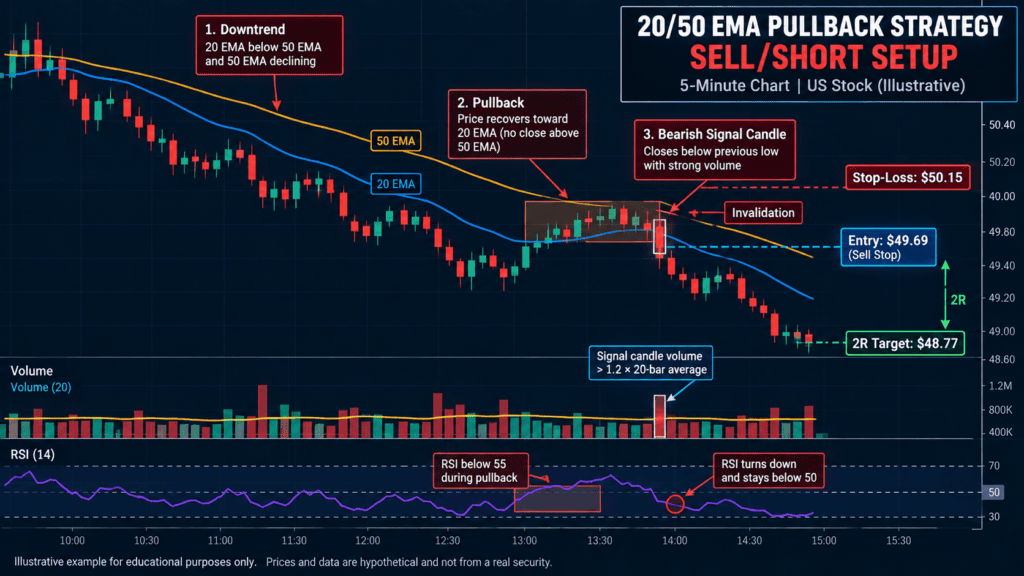
4. SELL/SHORT Setup: The Bearish EMA Pullback
The short setup applies the same general concept in the opposite direction.
Instead of looking for a recovery within an uptrend, it looks for a failed recovery within a downtrend.
Short selling has additional execution and borrowing considerations. A broker may require the shares to be available for borrowing, and borrowing costs or restrictions can affect the trade. Losses on short stock positions can also be substantial if prices rise sharply.
Step 1: Confirm the Bearish Trend
All conditions must be satisfied:
- The 20 EMA is below the 50 EMA.
- The current 50 EMA is lower than its value three completed bars earlier.
- At least three of the previous four completed candles closed below the 50 EMA.
- Price has not decisively reclaimed the 50 EMA.
If the averages are flat or repeatedly crossing, skip the trade.
Step 2: Identify the Recovery Toward the 20 EMA
Wait for price to bounce toward the 20 EMA.
The recovery must satisfy these conditions:
- At least one of the previous three completed candles has a high within 0.20 ATR of the 20 EMA.
- No candle during the recovery closes above the 50 EMA.
- The recovery produces a recognizable local high.
- Price does not recover so strongly that the bearish trend condition is no longer valid.
This creates a potential short-selling opportunity only when the broader trend filter remains intact.
Step 3: Confirm RSI Behavior
During the recovery, RSI should remain between 35 and 55.
The signal candle must satisfy both conditions:
- RSI is below 50.
- RSI is lower than its value on the previous completed candle.
This suggests that momentum has turned downward again under the strategy’s predefined rules.
RSI alone is not sufficient to justify a short position.
Step 4: Confirm the Bearish Signal Candle
The signal candle must:
- Close below the previous candle’s low.
- Close below its own opening price.
- Have volume at least 1.2 times the average volume of the previous 20 completed bars.
- Close below the 20 EMA.
All conditions must be met on the same completed signal candle.
Step 5: Define the Short Entry
Place a sell-stop entry trigger one minimum price increment below the signal candle’s low.
The entry must trigger within the next three completed five-minute bars.
If it does not, cancel the setup.
Before placing a short order, confirm that the security can be shorted through the broker and that the required shares are available. Account for borrow fees, execution costs, and any broker-specific restrictions.
Step 6: Calculate the Stop-Loss
Identify the highest high of the five completed candles ending with the signal candle.
Set the stop above that high by the greater of:
- 0.10 ATR; or
- One minimum price increment.
Calculate:
Initial risk per share = Stop-loss price − Entry price
Reject the trade if the stop distance is less than 0.25 ATR or greater than 1.50 ATR.
Step 7: Set the Short Target
The target is two times the initial risk below the entry.
Target price = Entry price − 2 × Initial risk per share
If the entry is $50.00 and the stop is $50.40:
- Initial risk per share: $0.40.
- Target at 2R: $49.20.
The target does not guarantee that the stock will fall to that price.
Step 8: Exit the Short Position
Cover the position when:
- The stop-loss is triggered.
- The 2R profit target is reached.
- The scheduled end-of-day exit arrives.
Do not increase the stop-loss distance because the stock is moving against the trade.
Short positions can become more difficult to manage during sudden upward price movements, trading halts, or periods of poor liquidity.
5. Illustrative Trade Examples
The following examples use invented prices to demonstrate the calculations. They are not live market quotes, historical trading results, or evidence of profitability.
Example A: BUY/LONG
Suppose a hypothetical US stock meets the bullish trend conditions.
Its 20 EMA is above the 50 EMA, the 50 EMA is rising, and price pulls back toward the 20 EMA without invalidating the trend.
The stock then produces a bullish signal candle satisfying the RSI and volume conditions.
Assume the resulting trade levels are:
| Trade component | Illustrative value |
|---|---|
| Entry trigger | $100.26 |
| Stop-loss | $99.90 |
| Risk per share | $0.36 |
| Target at 2R | $100.98 |
The calculation is:
Risk per share = $100.26 − $99.90 = $0.36
Target = $100.26 + (2 × $0.36) = $100.98
The planned reward is $0.72 per share before transaction costs and slippage.
This example demonstrates the arithmetic only. It does not suggest that a stock is likely to move from $100.26 to $100.98.
Example B: SELL/SHORT
Suppose a different hypothetical stock is in a confirmed bearish trend.
The 20 EMA is below the 50 EMA, the 50 EMA is falling, and price recovers toward the 20 EMA before producing a bearish signal candle.
Assume the resulting trade levels are:
| Trade component | Illustrative value |
|---|---|
| Short entry trigger | $49.69 |
| Stop-loss | $50.15 |
| Risk per share | $0.46 |
| Target at 2R | $48.77 |
The calculation is:
Risk per share = $50.15 − $49.69 = $0.46
Target = $49.69 − (2 × $0.46) = $48.77
The planned reward is $0.92 per share before transaction costs, borrowing costs, and slippage.
A short trade should not be entered if the required shares are unavailable, execution conditions are poor, or the trade does not meet the predefined risk criteria.
6. Position Sizing: How Much Should You Trade?
Position sizing is a central component of a rules-based strategy.
A valid technical setup does not automatically justify a large position. The number of shares should depend on the amount of capital at risk and the distance between entry and stop-loss.
The Position-Sizing Formula
Maximum planned risk = Account equity × Risk percentage
Then:
Position size = Maximum planned risk ÷ Risk per share
For a more realistic calculation, include estimated transaction costs and execution risk.
A conservative version is:
Position size = Floor [Risk budget ÷ (Entry-to-stop distance + Estimated per-share costs)]
The resulting size must also comply with liquidity, buying-power, concentration, and broker restrictions.
Worked Position-Sizing Example
Assume:
- Account equity: $20,000.
- Risk budget per trade: 0.25%.
- Entry: $100.26.
- Stop-loss: $99.90.
- Risk per share: $0.36.
The maximum planned risk is:
$20,000 × 0.25% = $50
The theoretical position size before costs is:
$50 ÷ $0.36 = 138.88 shares.
Since fractional sizing may not be available or appropriate for every implementation, round down to 138 shares.
For a more conservative illustrative position, suppose the trader uses 130 shares.
The initial price risk is:
130 × $0.36 = $46.80
This amount excludes commissions, slippage, and any other costs.
If estimated costs increase the amount at risk, the position should be reduced accordingly.
Daily Risk Limits
The proposed strategy uses these safeguards:
- Maximum planned risk of 0.25% of account equity per trade.
- Stop trading after two full-risk losses or a 0.5% loss of starting daily equity, whichever occurs first.
- Maximum of three trades per day.
- No adding to losing positions.
- No widening the initial stop-loss.
- No new trade if the required position size exceeds the allowed risk budget.
These are research parameters, not universally optimal risk limits.
Traders should also account for gaps, halts, poor liquidity, and stop orders that execute at prices worse than expected.
FINRA’s educational material emphasizes that frequent intraday trading carries substantial risks, particularly when borrowing or margin is involved. Traders should understand their broker’s current requirements before implementing a strategy.
7. When Not to Trade This Strategy
A strong strategy specification must identify when to reject a setup, not only when to enter.
Avoid Sideways Markets
When the 20 EMA and 50 EMA repeatedly cross, the trend filter may generate contradictory signals.
Price can move above and below the averages without developing a sustained direction.
The strategy should skip such conditions rather than repeatedly entering and exiting.
Avoid Chasing Extended Price Movements
If the signal candle is unusually large or price has already moved far away from the 20 EMA, the planned entry may offer an unattractive stop distance.
Reject trades that fail the defined ATR stop-distance filter.
Avoid Poor Liquidity
A chart pattern may appear attractive while the bid-ask spread makes the actual trade uneconomical.
This matters particularly when a strategy uses short timeframes and relatively small price movements.
Be Cautious Around Scheduled Announcements
High-impact US economic releases can produce sudden price movements and wider spreads.
A conservative implementation should avoid new entries immediately around scheduled announcements unless the strategy has been separately tested under those conditions.
Similarly, individual stocks reporting earnings may behave differently from ordinary sessions.
Do Not Assume Short Selling Is Always Available
Short-selling eligibility, borrow availability, costs, and broker restrictions can change.
The strategy should record rejected short signals separately from executed trades to avoid overstating the number of opportunities that could realistically have been traded.
8. Backtesting Methodology: How to Test the Strategy Properly
The strategy’s effectiveness cannot be established from a handful of attractive chart examples.
A proper backtest must apply the rules consistently across a sufficiently broad sample of market conditions.
No performance figures are provided here because no completed historical test has been conducted for this specification.
Step 1: Define the Test Universe
Select a point-in-time universe of eligible US stocks and ETFs.
Avoid selecting only securities that are successful today. Doing so can introduce survivorship bias.
Include appropriate historical corporate actions and account for securities that were delisted or otherwise ceased trading during the test period.
Step 2: Obtain Reliable Five-Minute Data
Collect historical five-minute OHLCV data for the selected securities.
Verify:
- Timestamp and time-zone consistency.
- Missing or duplicated bars.
- Corporate-action adjustments.
- Trading halts.
- Regular-session boundaries.
- Historical volume accuracy.
The data must reflect the information that would have been available at each decision point.
Step 3: Implement the Rules Without Discretion
Program the EMA, RSI, ATR, volume, entry, stop-loss, target, and time-exit conditions exactly as specified.
For example, the long setup should not be accepted simply because a chart looks bullish.
Every required condition must be true.
Calculate indicator values using completed candles and generate the entry only after the relevant confirmation candle has closed.
Step 4: Model Realistic Execution
A backtest should account for:
- Bid-ask spreads.
- Commissions and fees where applicable.
- Slippage.
- Entry-trigger behavior.
- Stop-loss execution.
- Target execution.
- Short-borrow availability and costs.
- End-of-day liquidation.
- Gaps and trading halts where the data permits.
A stop price is not necessarily the price at which a real order will execute.
If a stop and target are both touched within a candle, use finer-grained data when available. Otherwise, apply the conservative stop-first assumption.
Step 5: Divide the Data Chronologically
A possible initial design is:
| Dataset | Share of historical period | Purpose |
|---|---|---|
| Training | 60% | Develop the initial specification |
| Validation | 20% | Evaluate whether the rules generalize |
| Out-of-sample test | 20% | Evaluate performance on unseen data |
These proportions are illustrative, not mandatory.
Do not repeatedly adjust the rules after examining the final test period. Doing so would undermine the independence of the out-of-sample evaluation.
Step 6: Evaluate the Results
Record at least the following statistics:
- Win rate: Percentage of closed trades with positive net results.
- Average win: Average profit per winning trade after costs.
- Average loss: Average loss per losing trade after costs.
- Expectancy: Average net profit or loss per trade.
- Profit factor: Gross profits divided by gross losses.
- Maximum drawdown: Largest peak-to-trough decline in the equity curve.
- Average R per trade: Average net result expressed in units of initial risk.
- Trade frequency: Number of trades per day, week, and month.
- Execution sensitivity: How the results change when realistic slippage and transaction costs increase.
A high win rate does not necessarily indicate a profitable strategy. A small number of large losses can outweigh many small winning trades.
Likewise, a strategy with a lower win rate can still have positive expectancy if its winning trades are sufficiently large relative to its losses.
Step 7: Test Different Market Environments
Evaluate the strategy separately across:
- Strongly trending markets.
- Weakly trending markets.
- Sideways and choppy periods.
- High-volatility sessions.
- Low-volatility sessions.
- Different US market sectors.
- Different liquidity levels.
The purpose is to identify where the strategy performs poorly as well as where it performs well.
Step 8: Test Parameter Sensitivity
The initial specification uses a 20 EMA, 50 EMA, RSI 14, ATR 14, and a 2R target.
Test whether modest changes to these parameters materially alter the results.
If performance collapses when a parameter changes slightly, the strategy may be overfitted to the historical sample.
Do not choose settings merely because they produce the best historical return.
Step 9: Paper Trade Before Committing Capital
After completing the historical analysis, run the strategy in a simulated environment.
Record whether the signals appear at the expected times and whether the entry and exit prices are realistically achievable.
Paper trading cannot reproduce every live execution condition, but it can reveal coding mistakes, operational problems, and unrealistic assumptions.
Step 10: Document the Final Results Honestly
Report the number of trades, costs, test period, symbols, market conditions, and methodology.
Separate in-sample, validation, and out-of-sample results.
Do not describe hypothetical results as actual trading performance, and do not assume historical profitability will continue in future markets.
9. Entry and Exit Rules + Chart Visuals
A. BUY/LONG Chart Visual
Chart requirements
- Five-minute US stock candlestick chart.
- Dark navy or charcoal institutional appearance.
- Realistic OHLC candles with natural wicks.
- 20 EMA shown as a clearly labeled blue line.
- 50 EMA shown as a clearly labeled amber line.
- RSI 14 panel below the price chart.
- Volume bars beneath the main chart.
- A clearly marked pullback toward the 20 EMA.
- A bullish signal candle meeting the strategy’s requirements.
- Entry, stop-loss, target, and invalidation annotations.
- All illustrative prices clearly labeled.
B. SELL/SHORT Chart Visual
Chart requirements
- Five-minute US stock candlestick chart.
- Dark navy or charcoal institutional appearance.
- 20 EMA shown as a clearly labeled blue line.
- 50 EMA shown as a clearly labeled amber line.
- RSI 14 panel below the price chart.
- Volume bars beneath the main chart.
- A bearish trend followed by a recovery toward the 20 EMA.
- A bearish signal candle satisfying the strategy rules.
- Short entry, stop-loss, target, and invalidation annotations.
- Clearly identified illustrative prices.
10. Common Mistakes That Can Damage Results
Even a clearly specified strategy can be implemented poorly.
Mistake 1: Entering Before the Signal Candle Closes
The signal may disappear before the candle is complete.
Correction: Calculate the signal using completed candles only.
Mistake 2: Ignoring the Trend Filter
A bullish candle during a bearish trend does not automatically qualify as a long setup.
Correction: Require the EMA arrangement and slope conditions to be satisfied.
Mistake 3: Treating RSI as a Prediction
RSI measures momentum; it does not tell a trader with certainty what price will do next.
Correction: Use RSI only as one component of the complete setup.
Mistake 4: Entering Without Calculating the Stop
An attractive chart pattern does not justify an undefined amount of risk.
Correction: Determine the stop-loss and position size before entry.
Mistake 5: Chasing a Missed Signal
If price has already moved beyond the planned entry, the original reward-to-risk calculation may no longer be valid.
Correction: Cancel expired signals and wait for another valid setup.
Mistake 6: Ignoring Trading Costs
Small intraday price movements can be significantly affected by spreads and slippage.
Correction: Include realistic execution costs in every backtest.
Mistake 7: Changing the Rules After Every Loss
Frequent discretionary changes can make a strategy impossible to evaluate objectively.
Correction: Maintain a trading journal and change parameters only through a documented testing process.
Mistake 8: Assuming the Strategy Works in Every Market
Trend-following approaches can struggle in sideways conditions.
Correction: Measure performance by market regime and use the trend filter consistently.
11. Frequently Asked Questions
Is the 20/50 EMA Pullback Strategy Suitable for Beginners?
It can be studied by beginners because its rules are explicit. However, understanding the indicators is not enough. Traders should first learn order execution, stop-loss behavior, position sizing, and backtesting.
Which Timeframe Does the Strategy Use?
The initial specification uses five-minute candles during the regular US trading session. Other timeframes would require separate testing.
Can the Strategy Be Used for US ETFs?
Yes. The framework can be tested on liquid US-listed ETFs, but ETF behavior and execution costs may differ from those of individual stocks.
Does the Strategy Work for Both Long and Short Trades?
It provides separate long and short rules. Their results should be evaluated separately rather than assuming that performance will be symmetrical.
Does a 20 EMA Crossing Above a 50 EMA Trigger an Entry?
No. The EMA relationship is a trend filter. The strategy additionally requires a pullback, RSI confirmation, a qualifying signal candle, sufficient relative volume, and a valid entry trigger.
Is the 2R Target Guaranteed to Be Reached?
No. A 2R target defines the planned reward relative to the initial risk. It does not indicate the probability of reaching that target.
How Many Trades Should Be Backtested?
There is no universal minimum that establishes validity. A small sample can produce misleading results, so the strategy should be tested across a broad range of securities, dates, and market conditions. Report the number of trades and the uncertainty around the results.
Can the Strategy Be Automated?
Yes, its rules can be translated into code, provided the implementation handles completed candles, order triggers, stop-loss execution, costs, trading hours, and data quality correctly.
12. Conclusion: Test the Rules Before Trusting the Results
Trade Smarter with BacktestCart
Explore trading insights, strategies, and practical resources to sharpen your trading knowledge.
Explore Trading Articles Visit Our Digital Store →The 20/50 EMA Pullback Strategy combines four components: trend direction, pullback structure, momentum confirmation, and volume.
Its strength as a research framework is that each component has a defined role.
The EMA relationship identifies the proposed trend. Price action identifies the pullback. RSI provides a momentum filter. Volume adds a participation condition. Position sizing and predefined exits limit the planned risk of each trade.
However, these features do not establish profitability.
The next step is to implement the rules precisely, test them on reliable historical data, account for realistic execution costs, and evaluate their performance across different market environments.
A strategy should be judged by evidence, not by how attractive a few chart examples appear.
The BacktestCart principle: Define the setup. Measure the risk. Test the evidence.
Risk Disclaimer
This article is for educational and informational purposes only. It is not individualized investment advice or a recommendation to buy or sell any security. Trading can result in substantial losses. Short selling carries additional risks, and stop orders may execute at prices different from their trigger levels. Historical and hypothetical backtest results do not guarantee future performance.