
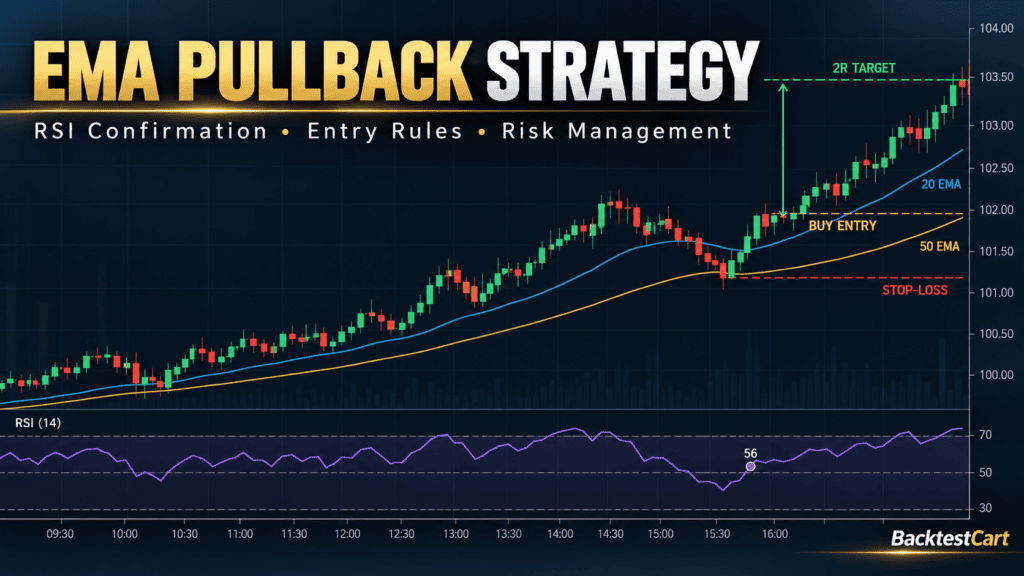
Many intraday traders struggle with the same problem: they identify the market’s direction correctly but enter at the wrong time.
A stock may be moving higher, yet buying after several consecutive bullish candles can leave a trader exposed to a sudden pullback. Similarly, selling after an extended decline can mean entering just before a temporary recovery.
One way to approach this problem is to combine trend identification with a pullback and momentum confirmation.
The EMA Pullback Strategy With RSI Confirmation uses three technical indicators:
- 20-period Exponential Moving Average (EMA): Identifies the shorter-term trend and potential pullback area.
- 50-period Exponential Moving Average (EMA): Helps establish the broader intraday trend.
- 14-period Relative Strength Index (RSI): Helps assess whether momentum supports the proposed trade direction.
Instead of buying simply because the market is rising or selling because it is falling, this strategy requires a specific sequence of conditions before a trade can be considered.
The objective is to create a repeatable trading process with defined entry triggers, stop-loss placement, profit targets, and measurable backtesting rules.
Important: This is a strategy framework for testing, not a claim of proven profitability. Its performance must be evaluated using actual historical market data, realistic transaction costs, and consistent execution rules.
1. Understanding the Three Indicators
Before applying the strategy, it is important to understand the role of each indicator.
The 20 EMA: Finding the Pullback Area
An Exponential Moving Average gives greater weight to recent prices than a Simple Moving Average.
The 20 EMA reacts relatively quickly to changing prices, making it useful for observing short-term momentum.
During an established uptrend, price may advance, retrace toward the 20 EMA, and then resume its upward movement.
During a downtrend, price may decline, recover toward the 20 EMA, and then continue lower.
The strategy uses this behavior to identify a potential pullback area. However, a touch of the 20 EMA alone is not a trade signal. Price must satisfy additional confirmation rules.
The 50 EMA: Establishing the Trend
The 50 EMA provides a slower reference for the prevailing intraday direction.
For a potential long trade, the 20 EMA must be above the 50 EMA.
For a potential short trade, the 20 EMA must be below the 50 EMA.
The strategy also requires both moving averages to be sloping in the appropriate direction.
This additional condition helps distinguish a directional market from one in which the moving averages are relatively flat.
Moving-average alignment does not guarantee continuation. Trends can weaken or reverse, which is why the entry confirmation and risk-management rules remain essential.
The 14 RSI: Confirming Momentum
The Relative Strength Index measures the speed and magnitude of recent price changes on a scale from 0 to 100.
This strategy uses the 50 level as its primary momentum reference.
- RSI above 50 supports bullish momentum.
- RSI below 50 supports bearish momentum.
- RSI near 50 indicates less decisive directional momentum.
The strategy also avoids taking new entries when RSI is outside its specified momentum band.
For long trades, RSI must be above 50 but no higher than 70.
For short trades, RSI must be below 50 but no lower than 30.
These are rules specific to this strategy, not universal definitions of overbought or oversold conditions.
2. Market, Timeframe, and Trading Requirements
Consistency begins with defining where and when the strategy will be used.
| Parameter | Strategy Rule |
|---|---|
| Market | Liquid US-listed stocks and ETFs |
| Chart timeframe | 5-minute candles |
| Fast moving average | 20-period EMA |
| Slow moving average | 50-period EMA |
| Momentum indicator | RSI, 14 periods |
| Long trend | 20 EMA above 50 EMA |
| Short trend | 20 EMA below 50 EMA |
| Long RSI range | Greater than 50 and at or below 70 |
| Short RSI range | Greater than or equal to 30 and below 50 |
| Initial profit target | 2 times initial risk |
| Maximum simultaneous positions | One per instrument |
| Maximum trades | Two per instrument per session |
| Risk per trade | A predefined fraction of account equity |
| Trade direction | Long or short, subject to all entry rules |
For US equities, use regular trading-session data and specify the session in the backtest configuration. The example framework below excludes the first 15 minutes and the final 30 minutes of the regular session.
That means the standard entry window is 9:45 a.m. to 3:30 p.m. Eastern Time, with open positions closed by the end of the regular session.
The timing rules are designed for US regular-session trading. They should not be transferred unchanged to markets with different trading hours.
A Practical Data Requirement
Use liquid instruments with reliable historical intraday data.
Before testing, define the eligible universe using criteria that can be applied consistently to historical data. Avoid selecting only today’s successful stocks, as doing so can introduce survivorship and selection bias.
Record the applicable tick size, commissions, exchange fees where relevant, and a realistic estimate of slippage.
These details matter because a strategy that appears profitable before costs may perform differently after execution expenses are included.
3. The Core Logic Behind the EMA Pullback Strategy
The strategy follows a simple sequence:
Trend → Pullback → Momentum Confirmation → Entry Trigger → Risk-Defined Exit
Each stage serves a different purpose.
Trend: The moving averages establish the direction in which trades are permitted.
Pullback: Price temporarily retraces toward the 20 EMA rather than requiring the trader to chase an extended move.
Momentum confirmation: RSI and the signal candle must support the intended direction.
Entry trigger: A predefined price level activates the trade.
Risk-defined exit: A structural stop-loss and fixed initial risk-to-reward target establish the exit plan before entry.
The strategy does not require the trader to predict the exact market high or low. It waits for a specific sequence and either takes the trade according to the rules or skips it.
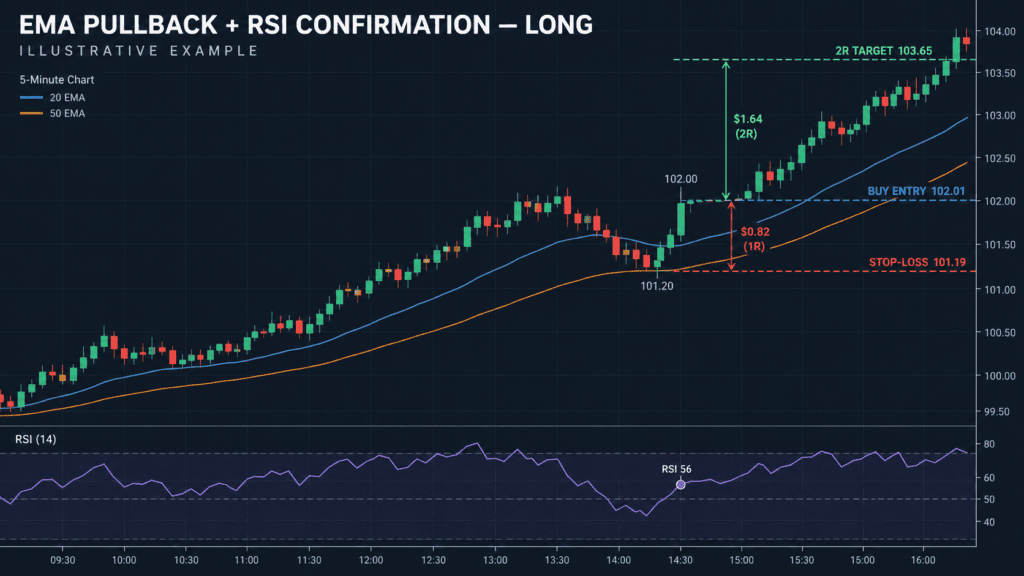
Example of a Potential Long Setup
Imagine a stock trading above its 50 EMA, with its 20 EMA above the 50 EMA.
The stock advances, then retraces toward the 20 EMA. During the retracement, at least one candle’s low touches or crosses the 20 EMA, while the pullback candles close above the 50 EMA.
A subsequent bullish candle closes above the previous candle’s high. At that moment, RSI is 56.
The setup meets the directional and momentum conditions. The trader can now define an entry trigger above the signal candle’s high and place a stop-loss below the pullback’s lowest price.
The trade is not entered simply because the stock touches the moving average.
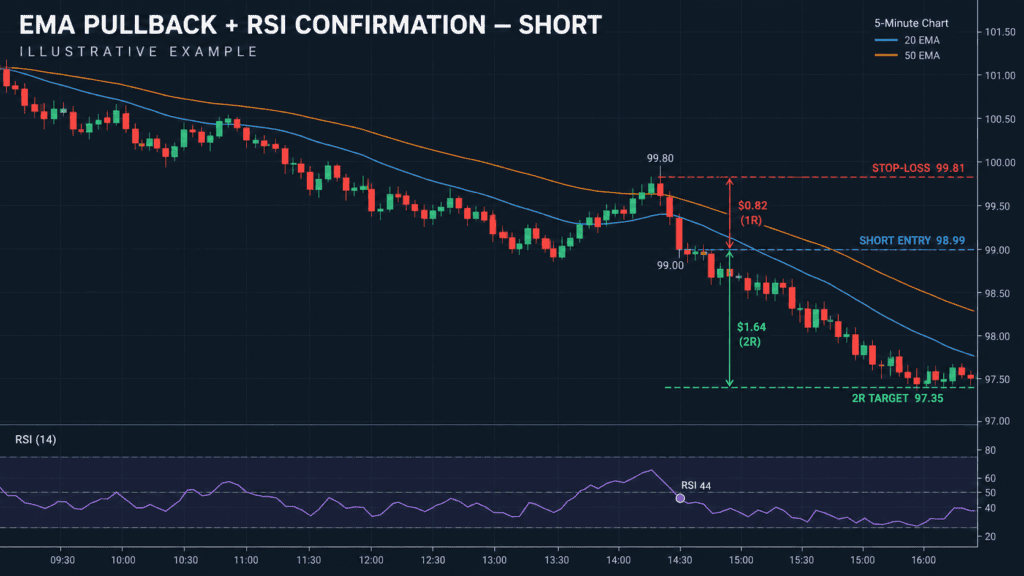
Example of a Potential Short Setup
Now imagine the opposite situation.
The 20 EMA is below the 50 EMA, and both are declining. Price temporarily rebounds toward the 20 EMA but remains below the 50 EMA at each candle’s close during the pullback.
A bearish candle then closes below the previous candle’s low. RSI is 44.
The trader identifies the pullback’s highest price, calculates the potential risk, and defines a short-entry trigger below the bearish signal candle.
Again, the setup requires a sequence of conditions rather than a single indicator reading.
4. EMA Pullback Strategy Flowchart
Use this decision flow before every potential entry.
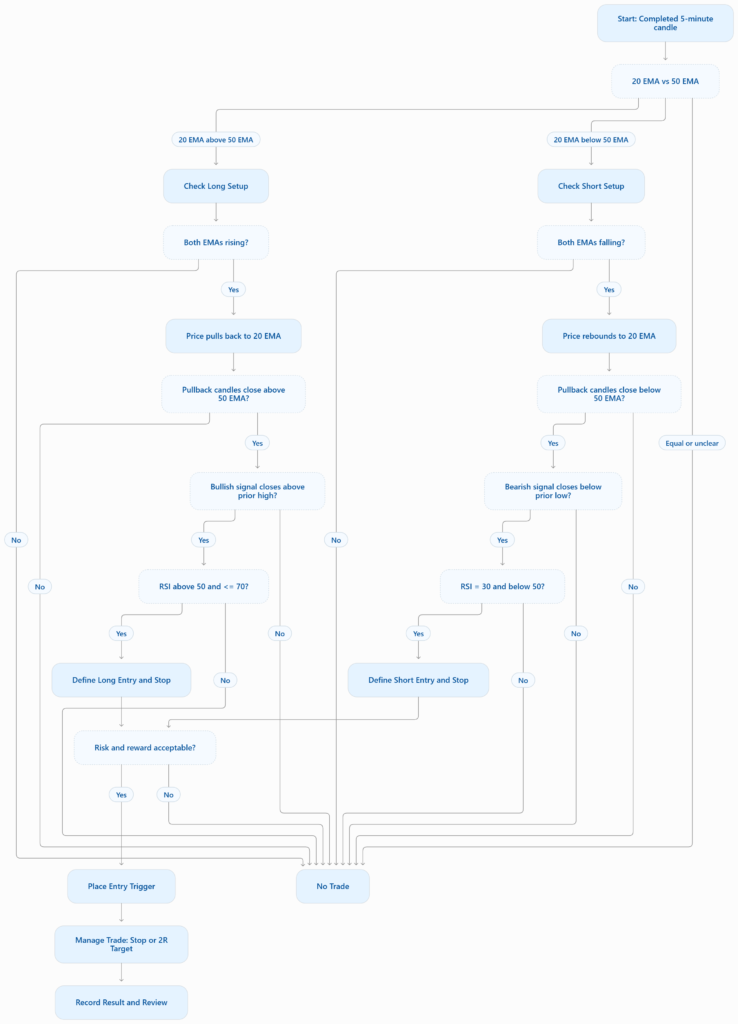
Flowchart note: Evaluate conditions using completed candles only. A setup is rejected if any required condition fails.
5. Entry & Exit Rules + Chart Visuals
This section defines the exact trading rules and the corresponding chart-generation prompts.
The BUY/LONG and SELL/SHORT setups are mirror images, but they must be evaluated independently. A valid long setup does not automatically imply that a short setup is valid, or vice versa.
A. BUY/LONG Entry Rules
A long trade is permitted only when all the following conditions are satisfied.
Rule 1: Confirm the bullish trend
- The 20 EMA is above the 50 EMA.
- The 20 EMA is higher than its value three completed candles earlier.
- The 50 EMA is higher than its value three completed candles earlier.
Both moving averages must therefore be rising, with the faster average above the slower one.
Rule 2: Identify the pullback
Price must retrace toward the 20 EMA.
At least one candle during the pullback must have a low at or below the 20 EMA. Every pullback candle must close above the 50 EMA.
The pullback is treated as a developing setup, not an immediate entry signal.
Rule 3: Wait for a bullish signal candle
A bullish signal candle must satisfy both conditions:
- Its close is above its open.
- Its close is strictly above the previous completed candle’s high.
This creates an observable confirmation condition rather than relying on the appearance of a bullish candle alone.
Rule 4: Confirm RSI
At the signal candle’s close, the 14-period RSI must be greater than 50 and no higher than 70.
If RSI is 50 or below, or above 70, reject the setup.
Rule 5: Calculate the entry
Place a buy-stop order one minimum tick above the signal candle’s high.
The order remains valid for the next three completed five-minute bars. Cancel it if the trigger is not reached during that period.
Do not enter retroactively at the signal candle’s close.
Rule 6: Calculate the stop-loss
Identify the lowest low among the pullback candles, including the signal candle.
Place the stop one minimum tick below that low.
The initial risk per share is:
Initial risk per share = Entry price − Stop-loss price
Reject the trade if the stop-loss is at or above the entry price.
Rule 7: Calculate the target
Set the initial profit target at two times the initial risk.
Target price = Entry price + (2 × Initial risk per share)
Once the trade is active, the original stop-loss and target remain fixed. Do not widen the stop to avoid taking a loss.
Rule 8: Apply the session and position limits
- Risk no more than the predefined account-risk percentage.
- Do not exceed two trades per instrument per session.
- Do not open another position in the same instrument while the first is active.
- Close any remaining position by the end of the specified trading session.
BUY/LONG Chart Example
Consider an illustrative five-minute chart with the following conditions:
| Item | Example Value |
|---|---|
| 20 EMA | $101.80 |
| 50 EMA | $101.40 |
| RSI | 56 |
| Pullback low | $101.20 |
| Signal candle high | $102.00 |
| Entry trigger | $102.01 |
| Stop-loss | $101.19 |
| Initial risk per share | $0.82 |
| Target at 2R | $103.65 |
Assume the minimum tick is $0.01 for this example.
The entry trigger is one tick above the signal candle’s high. The stop is one tick below the pullback low.
The risk per share is:
$102.01 − $101.19 = $0.82
The two-risk-unit target is:
$102.01 + (2 × $0.82) = $103.65
All prices are illustrative. The example demonstrates the arithmetic and is not evidence of a profitable historical trade.
B. SELL/SHORT Entry Rules
The short setup uses the opposite trend and momentum conditions.
Rule 1: Confirm the bearish trend
- The 20 EMA is below the 50 EMA.
- The 20 EMA is lower than its value three completed candles earlier.
- The 50 EMA is lower than its value three completed candles earlier.
Both moving averages must be falling.
Rule 2: Identify the rebound
Price must recover toward the 20 EMA.
At least one candle during the rebound must have a high at or above the 20 EMA. Every rebound candle must close below the 50 EMA.
Rule 3: Wait for a bearish signal candle
The signal candle must satisfy both conditions:
- Its close is below its open.
- Its close is strictly below the previous completed candle’s low.
Rule 4: Confirm RSI
At the signal candle’s close, RSI must be greater than or equal to 30 and strictly below 50.
Reject the setup if RSI is 50 or higher, or below 30.
Rule 5: Calculate the entry
Place a sell-stop order one minimum tick below the signal candle’s low.
The order remains valid for the next three completed five-minute bars. Cancel it if the trigger is not reached within that period.
Rule 6: Calculate the stop-loss
Identify the highest high among the rebound candles, including the signal candle.
Place the stop one minimum tick above that high.
The initial risk per share is:
Initial risk per share = Stop-loss price − Entry price
Reject the trade if the stop-loss is at or below the entry price.
Rule 7: Calculate the target
Set the initial profit target at two times the initial risk.
Target price = Entry price − (2 × Initial risk per share)
Keep the original stop-loss and target unchanged after entry.
Rule 8: Enforce risk limits
Use the same predefined account-risk percentage, trade limit, position limit, and session-end exit rules as the long setup.
SELL/SHORT Chart Example
Consider a separate illustrative five-minute chart.
| Item | Example Value |
|---|---|
| 20 EMA | $99.20 |
| 50 EMA | $99.60 |
| RSI | 44 |
| Rebound high | $99.80 |
| Signal candle low | $99.00 |
| Entry trigger | $98.99 |
| Stop-loss | $99.81 |
| Initial risk per share | $0.82 |
| Target at 2R | $97.35 |
Assume a $0.01 minimum tick.
The short-entry trigger is one tick below the signal candle’s low. The stop is one tick above the rebound high.
Initial risk per share:
$99.81 − $98.99 = $0.82
Target:
$98.99 − (2 × $0.82) = $97.35
These are illustrative prices, not live market quotes or backtest results.
6. Position Sizing and Risk Management
A well-defined entry does not automatically make a trading strategy safe.
Position sizing determines how much account capital is exposed if the stop-loss is reached.
A practical starting framework is to risk a small, predefined percentage of account equity on each trade. For example, a trader might test a 0.25% or 0.50% risk allocation rather than assuming that a particular percentage is universally appropriate.
Position Size Formula
Position size = Maximum permitted monetary risk ÷ Risk per share
The result must be rounded down to a whole share where fractional shares are not permitted.
The actual position must also respect applicable buying-power, liquidity, short-selling, and broker restrictions.
Position Sizing Example
Suppose an account has $20,000 in equity and the trader chooses a 0.50% risk limit.
Maximum planned risk:
$20,000 × 0.005 = $100
If the entry is $102.01 and the stop is $101.19, risk per share is $0.82.
Position size:
$100 ÷ $0.82 = approximately 121.95 shares.
Rounding down gives 121 shares.
The planned price-based risk is:
121 × $0.82 = $99.22
This calculation excludes commissions, fees, and slippage. In actual trading, the trader should account for these costs when determining an appropriate position size.
A stop order also does not guarantee execution at the specified price, particularly during gaps or fast-moving markets.
Essential Risk Rules
Never widen the initial stop-loss. If the trade moves against the position, accept the predefined risk rather than moving the stop farther away.
Do not average down or add to a losing position. The strategy has no averaging-down rule.
Avoid duplicate exposure. If the same stock or correlated instruments are already creating substantial exposure, evaluate total portfolio risk before opening another position.
Respect the daily trade limit. The framework permits no more than two trades per instrument per session.
Account for short-selling risks. Short positions may face borrow restrictions, additional fees, and potentially substantial losses if the price rises.
Stop trading when the rules are not satisfied. Missing a trade is preferable to inventing an entry that the system does not authorize.
7. How to Backtest the EMA Pullback Strategy
A strategy should not be considered effective simply because a few historical charts look attractive.
Backtesting evaluates whether the same predefined rules would have produced acceptable results across a sufficiently broad sample of historical observations.
The EMA Pullback Strategy should be tested separately for long and short trades before evaluating the combined results.
Step 1: Define the Historical Universe
Choose the eligible stocks or ETFs using a reproducible selection process.
Specify the trading period, session, minimum liquidity requirements, and data source before running the test.
Use historical universe membership where available to reduce survivorship bias. Include delisted instruments when appropriate to the research design.
Step 2: Obtain Reliable Five-Minute Data
The dataset should include timestamped OHLC candles and sufficient history to initialize the 50 EMA and 14-period RSI.
Check for missing bars, duplicate timestamps, inconsistent sessions, corporate-action adjustments, and incorrect time-zone handling.
Use only information that would have been available at the time of each historical decision.
Step 3: Calculate the Indicators
Calculate:
- 20-period EMA.
- 50-period EMA.
- 14-period RSI.
Document the initialization and calculation conventions. Different data vendors and platforms may produce slightly different indicator values.
Do not change indicator settings from one instrument to another unless that variation is explicitly part of a separate test.
Step 4: Program the Exact Entry Rules
For long trades, require bullish EMA alignment, rising moving averages, a qualifying pullback, a bullish signal close above the previous candle’s high, and RSI within the specified range.
For short trades, require bearish EMA alignment, falling moving averages, a qualifying rebound, a bearish signal close below the previous candle’s low, and RSI within its specified range.
Use completed candles for confirmation.
A signal discovered at the close of a candle cannot be treated as if it had been known earlier during that candle.
Step 5: Simulate Order Execution Correctly
For each valid signal, place the simulated stop-entry order one tick beyond the signal candle’s high or low, as applicable.
Keep the order active for the next three completed bars.
Cancel untriggered orders after that period.
If a bar’s high and low cross both the stop-loss and profit target during the same five-minute interval, the sequence may be unknowable from OHLC data alone. Use finer-grained data or apply a documented conservative execution assumption.
Do not automatically assume the more favorable sequence.
Also account for gaps through entry or stop levels, realistic slippage, and transaction costs.
Step 6: Use Consistent Exit Logic
Set the initial stop at the pullback extreme plus or minus one tick.
Set the initial target at 2R.
Close any remaining position at the prescribed session end.
Do not add discretionary exits to selected historical trades unless they are defined as a separate strategy variant and tested independently.
Step 7: Separate Development and Validation Data
Divide the historical sample chronologically.
Use the earlier portion to develop and debug the rules. Reserve a later, untouched period for out-of-sample evaluation.
For example, a researcher could use approximately 70% of the chronological history for development and 30% for validation. This is a testing design choice, not a guarantee of statistical reliability.
Where practical, use walk-forward testing to evaluate how the strategy behaves across successive market regimes.
Avoid repeatedly modifying the strategy based on the out-of-sample results and then continuing to call those same results independent validation.
Step 8: Record the Important Metrics
At a minimum, calculate the following:
| Metric | What It Measures |
|---|---|
| Total trades | Number of completed trades |
| Win rate | Percentage of trades with positive net results |
| Average winner | Average profit on winning trades |
| Average loser | Average loss on losing trades |
| Expectancy | Average net result per trade |
| Profit factor | Gross profits divided by gross losses |
| Maximum drawdown | Largest peak-to-trough decline |
| Average R-multiple | Average result relative to initial risk |
| Long-side expectancy | Average result for long trades |
| Short-side expectancy | Average result for short trades |
| Transaction costs | Commissions, fees, and modeled slippage |
Expectancy can be expressed as:
Expectancy = (Win rate × Average win) − (Loss rate × Average loss)
Here, win rate and loss rate are expressed as decimals, and the average win and loss are measured in the same units.
The calculation should use net outcomes if transaction costs are included in the reported performance.
Profit factor should be interpreted carefully when the sample contains few trades or unusually large winners.
Step 9: Evaluate Robustness
Check whether the results depend on a narrow group of instruments, a few exceptional trades, or a single market regime.
Evaluate the effects of realistic transaction costs, slightly different but reasonable parameter settings, and alternative market periods.
A strategy that collapses under minor changes may be overfitted.
Step 10: Conduct Forward Testing
After completing the historical evaluation, paper-trade the rules in a live market environment.
Record every eligible signal, including missed entries, unfilled orders, rejected setups, and execution differences.
The purpose is to test whether the strategy can be followed consistently and whether live execution resembles the assumptions used in the backtest.
Do not infer a win rate or expected return for this strategy until the backtest has actually been performed and the results have been independently checked.
8. Common Mistakes to Avoid
Entering Immediately When Price Touches the 20 EMA
A moving-average touch is only the pullback condition. The signal candle, RSI requirement, and entry trigger must also be satisfied.
Ignoring the Direction of the 50 EMA
A fast EMA above a slow EMA is not sufficient if the averages are flat or the trend conditions are otherwise invalid.
The rules explicitly require the appropriate three-candle slope check.
Entering Before the Signal Candle Closes
A candle may look bullish or bearish before its final close but finish differently.
Wait for the completed candle before evaluating its signal conditions.
Changing the RSI Rules Mid-Trade
The long RSI band is greater than 50 and at or below 70. The short RSI band is greater than or equal to 30 and below 50.
Changing those thresholds after observing individual historical trades can introduce selection bias.
Moving the Stop-Loss to Avoid a Loss
The stop-loss is based on the pullback extreme, not on the trader’s preferred monetary outcome.
If the resulting risk is too large, reduce the position size or skip the trade.
Assuming Every Entry Will Fill
A stop-entry order may never be triggered. It may also experience slippage when the market moves quickly.
A realistic backtest must model order behavior rather than assuming every signal produces an ideal fill.
Judging the Strategy by Win Rate Alone
A high win rate does not necessarily mean a strategy is profitable.
Average losses, average wins, costs, drawdown, and the distribution of outcomes all matter.
A lower-win-rate strategy may still have positive expectancy, while a high-win-rate strategy can lose money if its losses are sufficiently large.
9. How to Improve the Strategy Without Overfitting
Once a baseline backtest has been completed, evaluate potential improvements one at a time.
First, examine market conditions. Compare performance during trending periods and sideways periods to determine where the rules appear more or less effective.
Second, evaluate the entry window. Test alternative session windows as separate hypotheses rather than selecting the best-looking interval from a large number of attempts without validation.
Third, measure execution sensitivity. Determine how increased slippage, wider spreads, and delayed entries affect the results.
Fourth, inspect long and short performance separately. If one direction performs differently from the other, investigate whether the difference persists in independent data.
Fifth, compare exit methods as separate variants. A fixed 2R target is the baseline. Trailing stops or alternative targets should be evaluated as distinct strategies, not added selectively to improve historical results.
Every additional filter or parameter creates another opportunity to overfit. Improvements should be retained only when supported by a sound rationale and credible out-of-sample evidence.
10. Frequently Asked Questions
Is the EMA Pullback Strategy suitable for beginners?
The rules are straightforward enough to study and implement, but intraday trading still involves execution risk, rapid price changes, and the possibility of substantial losses. Beginners should understand order types, position sizing, and stop-loss limitations before using real capital.
Which timeframe does the strategy use?
The baseline framework uses five-minute candles. Results from other timeframes must be evaluated independently because changing the timeframe changes the signals and trading frequency.
Can the strategy be used for short selling?
Yes. The short setup uses the opposite EMA alignment, a rebound toward the 20 EMA, a bearish confirmation candle, and RSI below 50 but at or above 30. Actual short-selling eligibility depends on the instrument, broker, and applicable rules.
Does a 2R target mean the strategy will be profitable?
No. A 2R target defines the planned reward relative to the initial risk. It does not establish the probability of reaching that target or the strategy’s profitability after losses and trading costs.
Can this strategy be automated?
The rules can be translated into code for historical testing or automated execution. The implementation must handle completed-candle confirmation, order expiry, tick sizes, stop and target execution, session timing, and simultaneous stop-target touches.
Should the RSI settings be changed?
The baseline strategy uses RSI 14. Alternative settings may be researched, but changing the period should be treated as a separate experiment and validated on independent data.
How many trades should be backtested?
There is no universal number that proves a strategy is reliable. Seek a sufficiently large and diverse sample, examine long and short trades separately, and evaluate out-of-sample performance. A small number of successful examples is not adequate evidence.
Conclusion: Build a Repeatable Process Before Risking Capital
The EMA Pullback Strategy With RSI Confirmation provides a structured framework for studying intraday trend continuation.
Its strength as a research framework comes from its explicit conditions: the direction of both moving averages, the location of the pullback, the signal candle’s closing behavior, the RSI range, the entry trigger, and the initial stop-loss and target.
These rules make the strategy easier to implement consistently and evaluate objectively.
However, a clearly defined strategy is not necessarily a profitable one. Historical testing, realistic execution assumptions, independent validation, and disciplined risk management are necessary before drawing conclusions about its effectiveness.
Start with the baseline rules, record the results, and resist the temptation to optimize every disappointing trade.
The objective is not to find a setup that looks perfect on a chart. It is to determine whether a clearly defined process remains useful when tested across different instruments, market conditions, and periods.
Explore more trading education and strategy research at BacktestCart.